Yelp Results Presentation Deck
Financials
(աա)
Engagement
Metrics (mm)
Business
Metrics
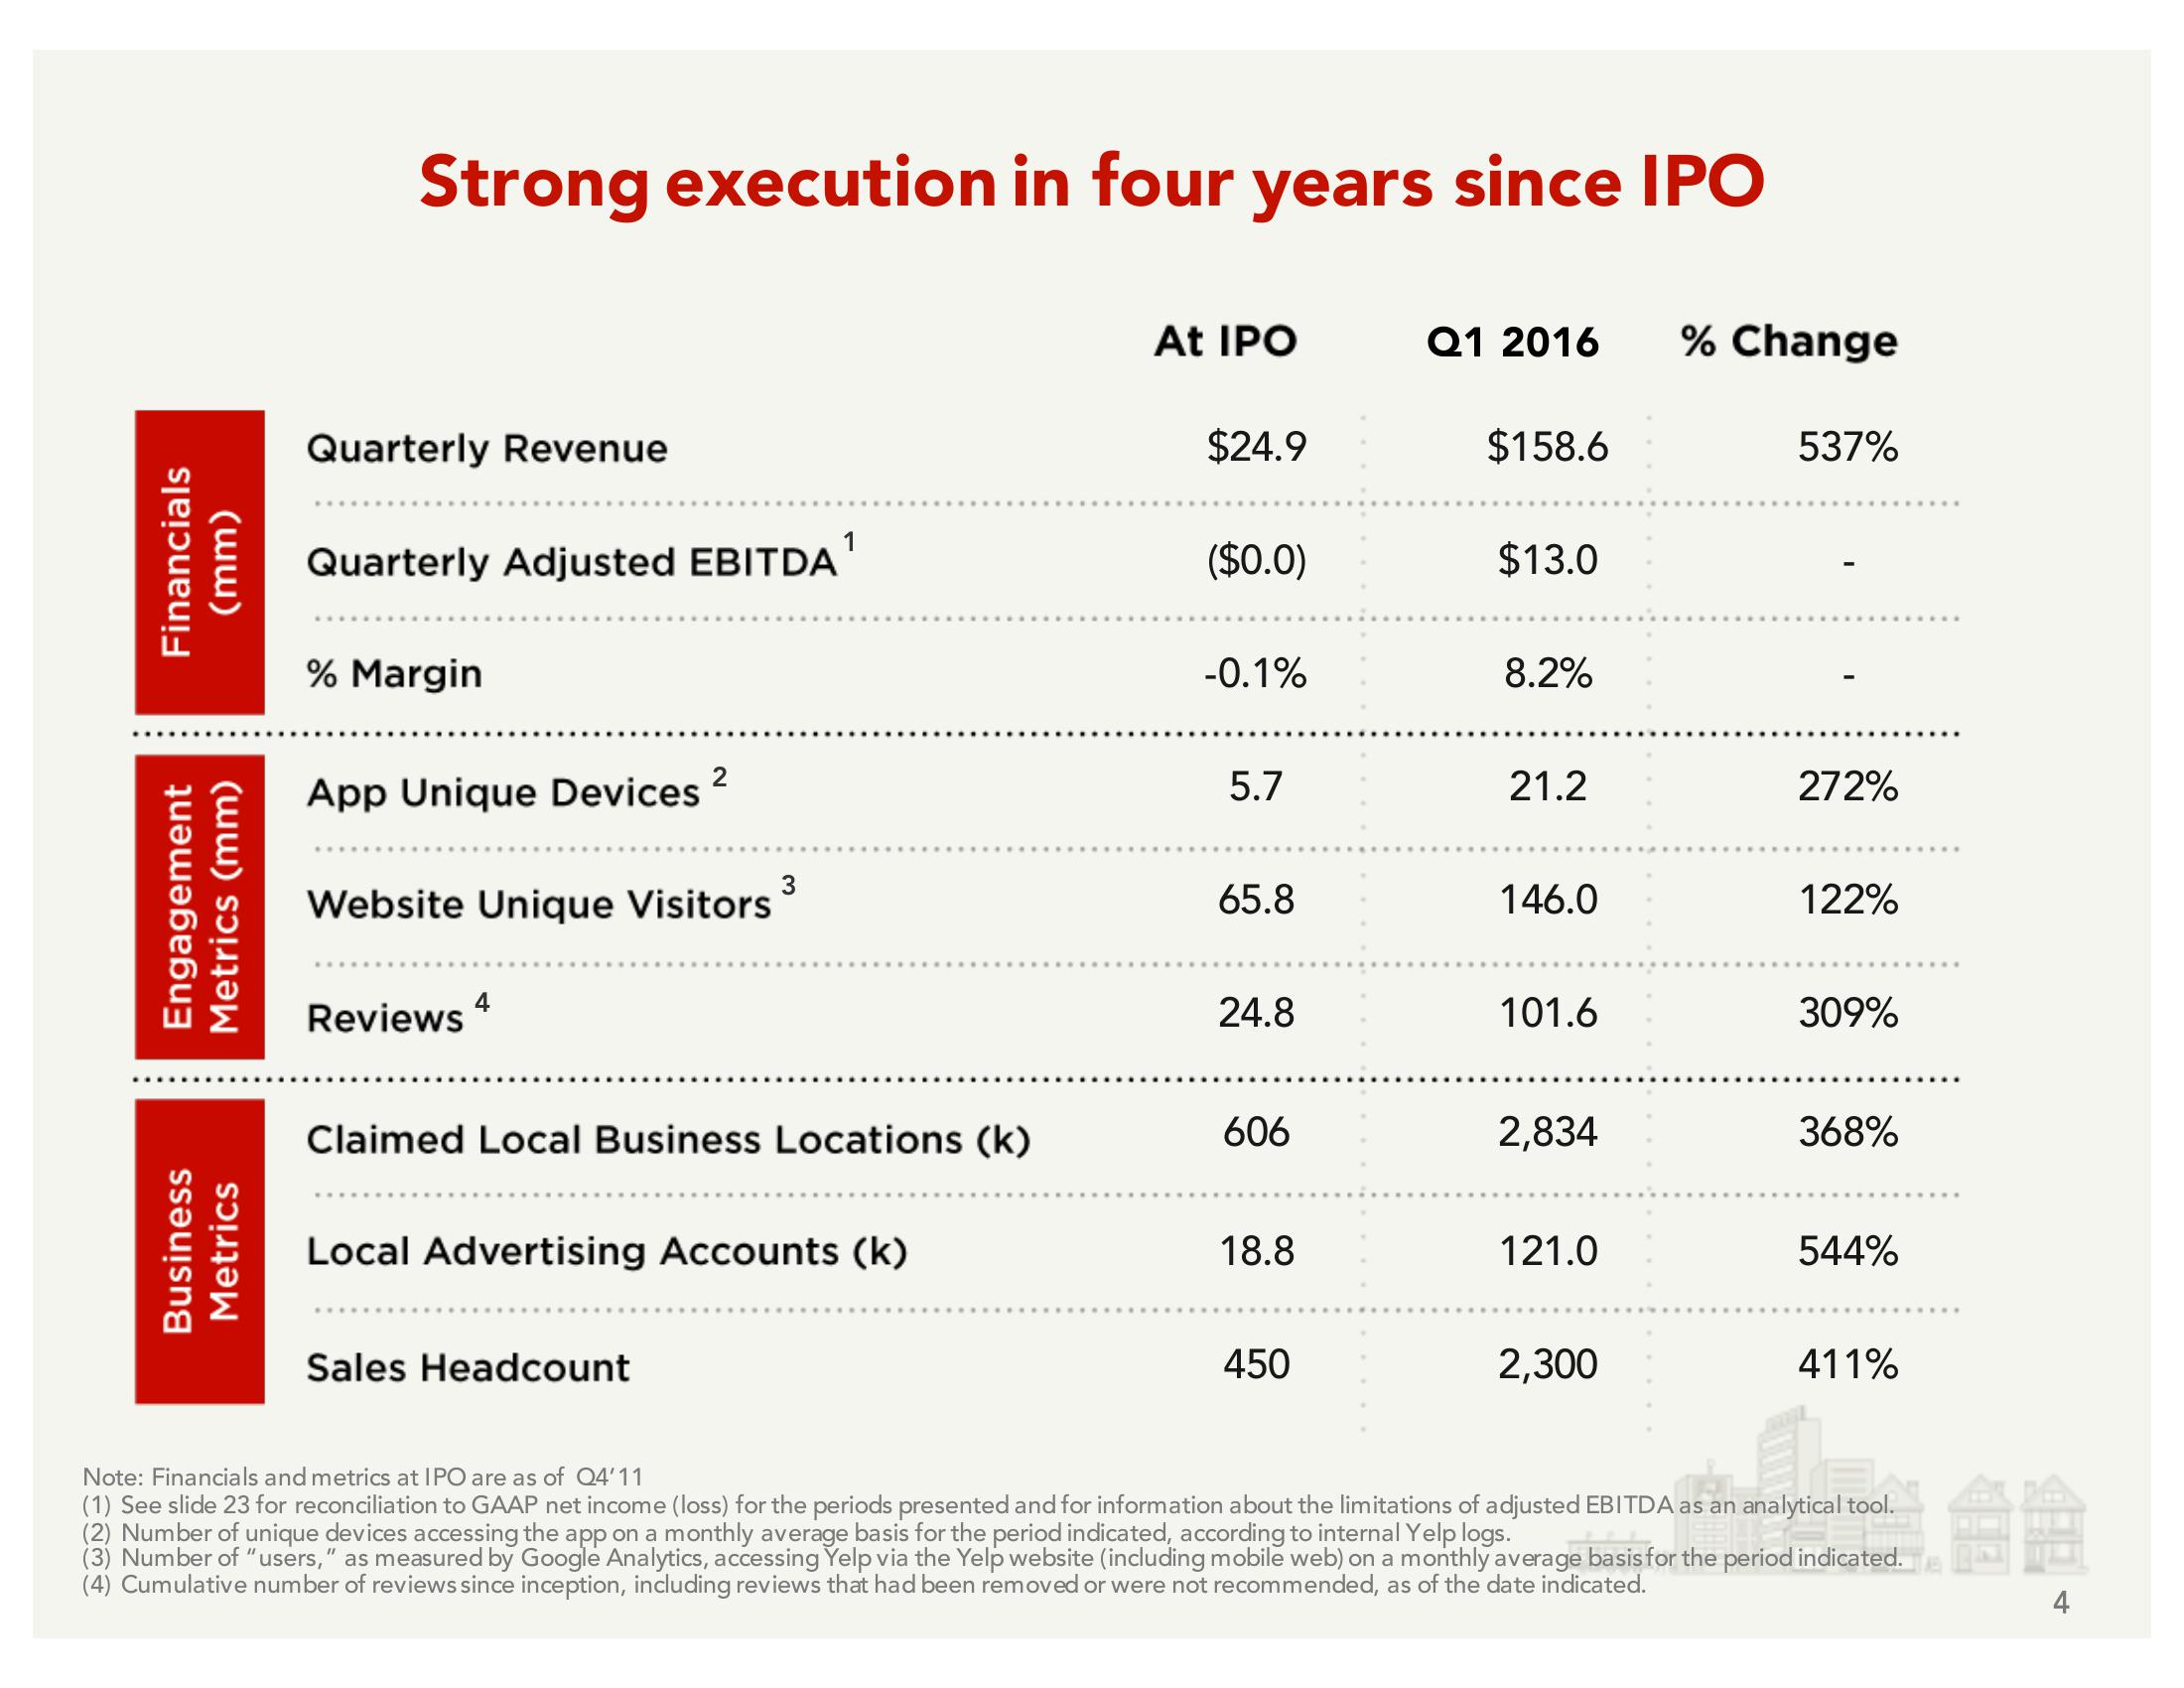
Strong execution in four years since IPO
Quarterly Revenue
Quarterly Adjusted EBITDA
% Margin
App Unique Devices
Website Unique Visitors
Reviews 4
3
Claimed Local Business Locations (k)
Local Advertising Accounts (k)
Sales Headcount
At IPO
$24.9
($0.0)
-0.1%
5.7
65.8
24.8
606
18.8
450
Q1 2016
$158.6
$13.0
8.2%
21.2
146.0
101.6
2,834
121.0
2,300
% Change
537%
272%
122%
309%
368%
544%
411%
Note: Financials and metrics at IPO are as of Q4'11
(1) See slide 23 for reconciliation to GAAP net income (loss) for the periods presented and for information about the limitations of adjusted EBITDA as an analytical tool.
(2) Number of unique devices accessing the app on a monthly average basis for the period indicated, according to internal Yelp logs.
(3) Number of "users," as measured by Google Analytics, accessing Yelp via the Yelp website (including mobile web) on a monthly average basis for the period indicated.
(4) Cumulative number of reviews since inception, including reviews that had been removed or were not recommended, as of the date indicated.
4View entire presentation