AvePoint Investor Presentation Deck slide image

AvePoint Investor Presentation Deck

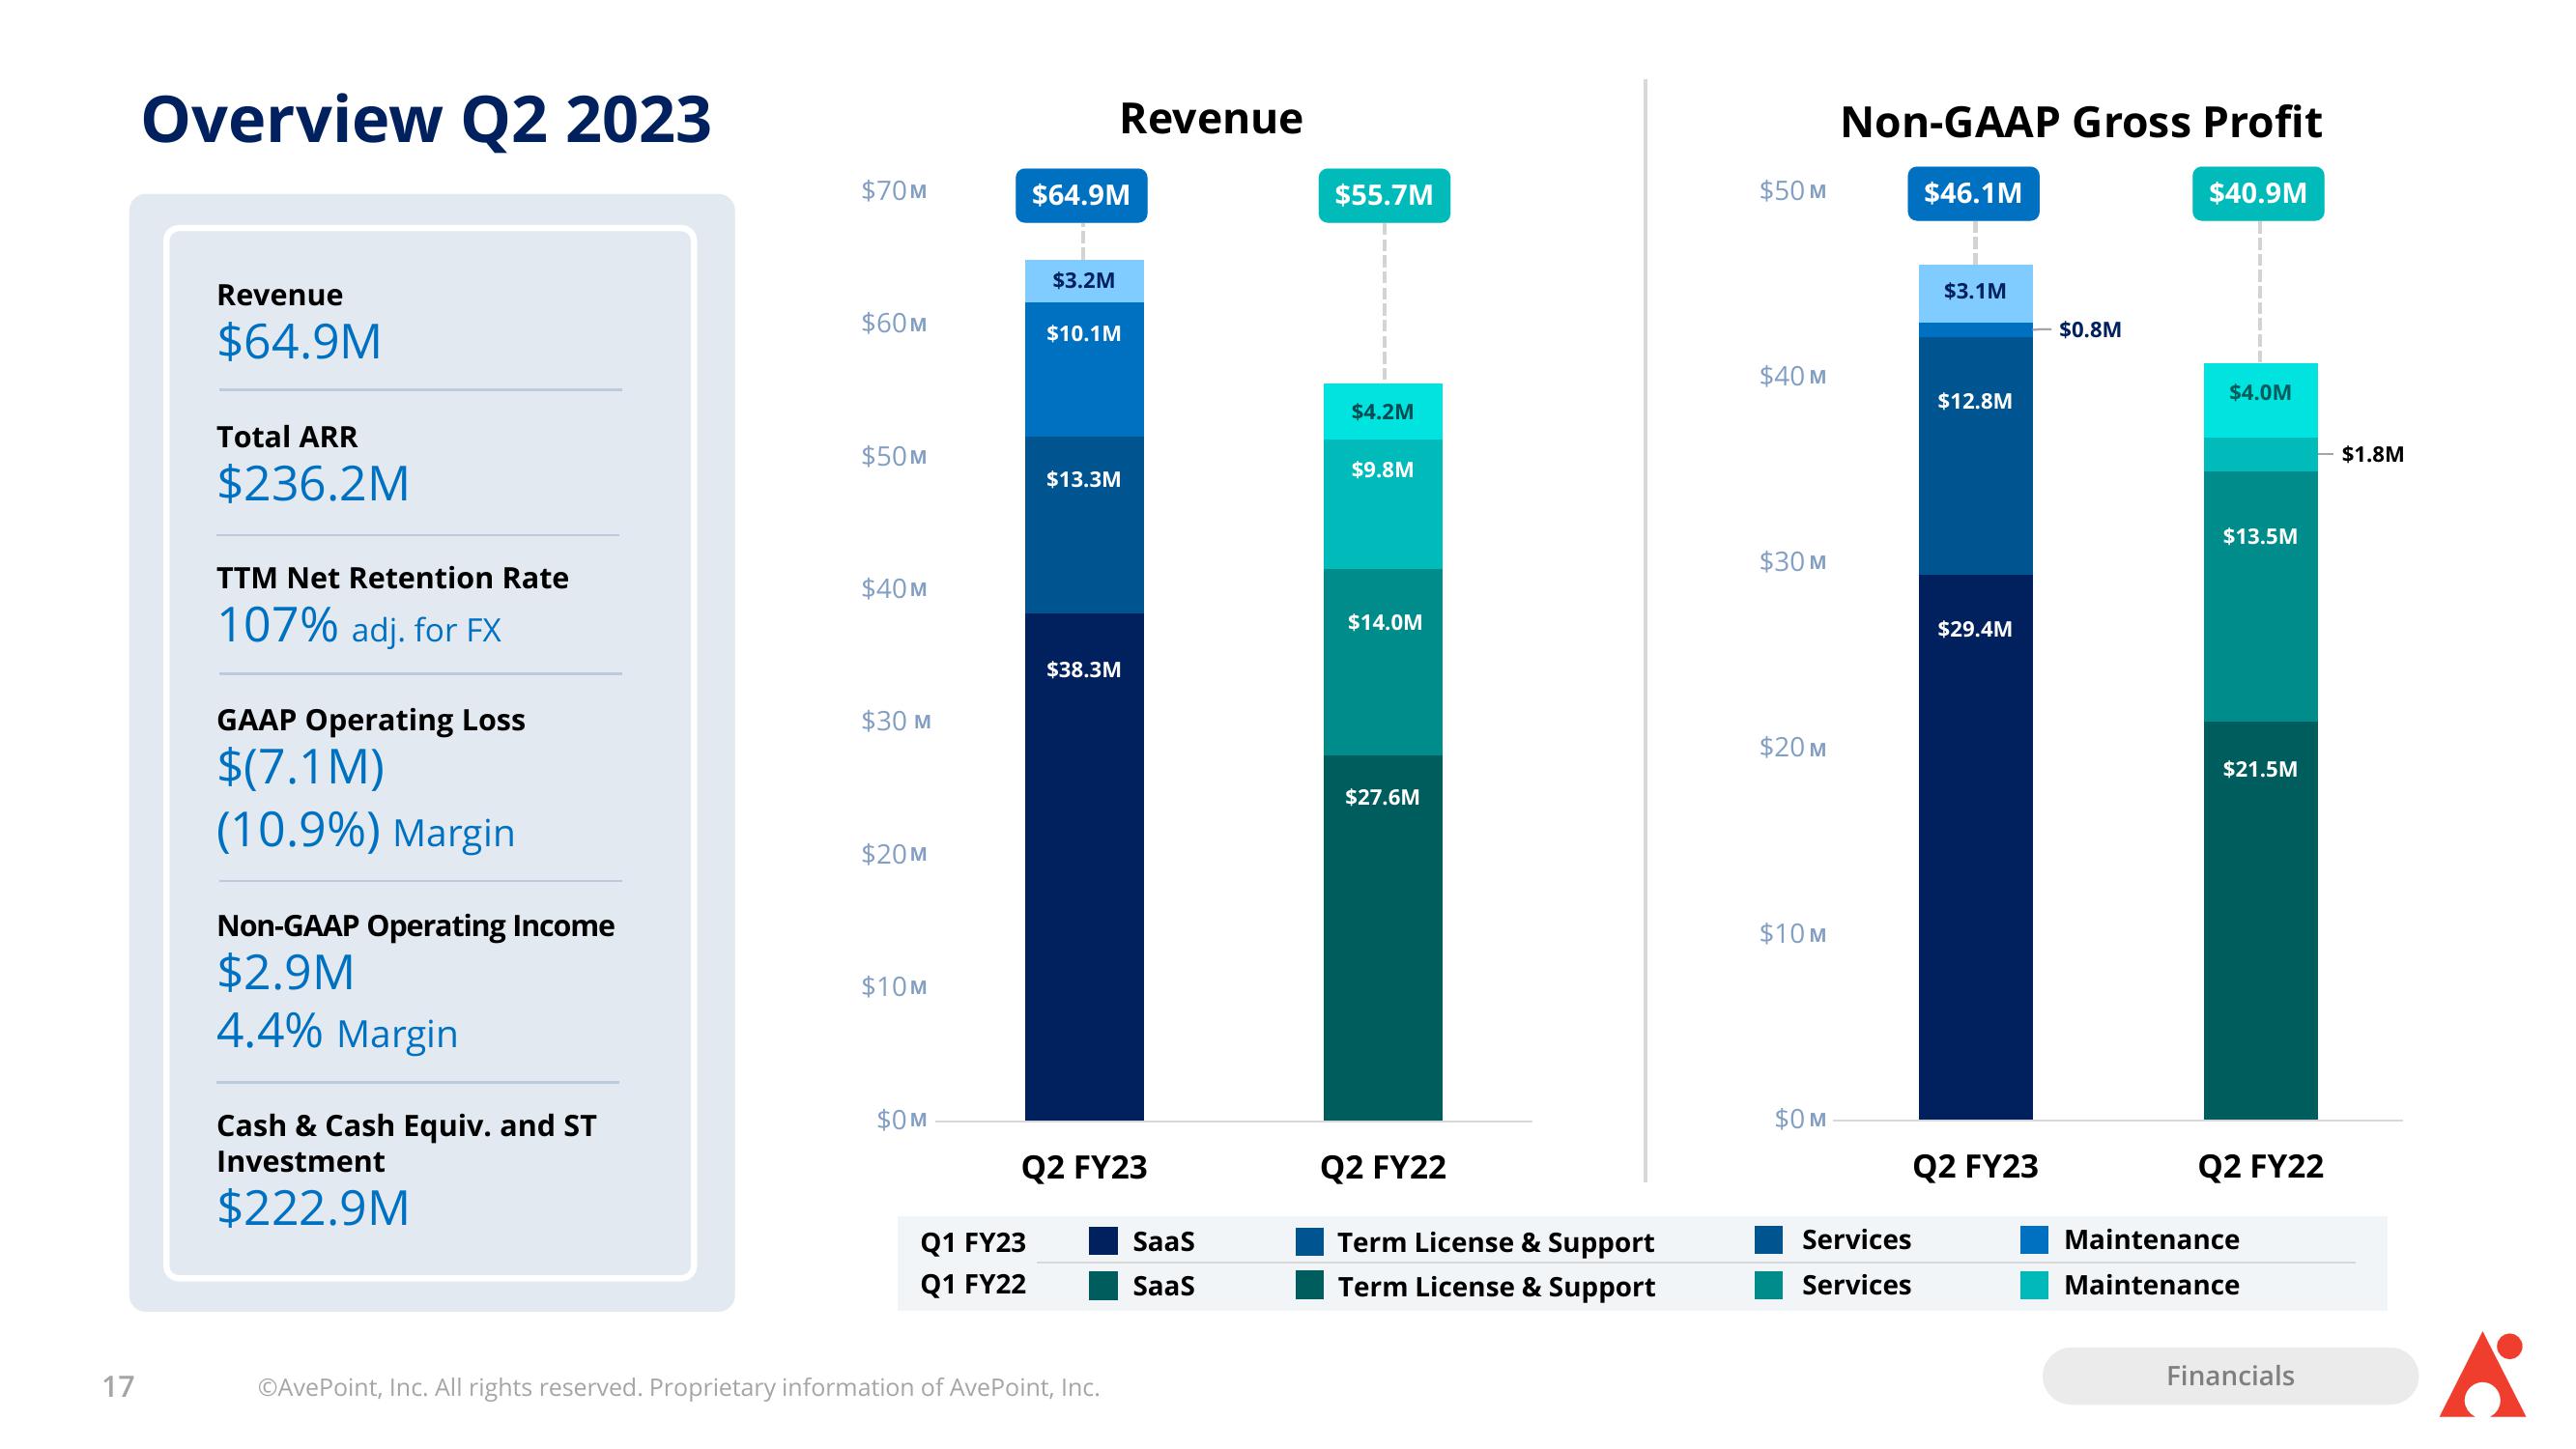
17 Overview Q2 2023 Revenue $64.9M Total ARR $236.2M TTM Net Retention Rate 107% adj. for FX GAAP Operating Loss $(7.1 M) (10.9%) Margin Non-GAAP Operating Income $2.9M 4.4% Margin Cash & Cash Equiv. and ST Investment $222.9M $70M $60M $50M $40M $30 M $20M $10M $0M Q1 FY23 Q1 FY22 $64.9M $3.2M $10.1M $13.3M $38.3M Revenue Q2 FY23 ©AvePoint, Inc. All rights reserved. Proprietary information of AvePoint, Inc. SaaS SaaS $55.7M $4.2M $9.8M $14.0M $27.6M Q2 FY22 Term License & Support Term License & Support $50 M $40 M $30 M $20 M $10M $0 M Non-GAAP Gross Profit $46.1M Services Services $3.1M $12.8M $29.4M Q2 FY23 $0.8M $40.9M $4.0M $13.5M $21.5M Q2 FY22 Maintenance Maintenance Financials $1.8M 6
View entire presentation