Comcast Results Presentation Deck
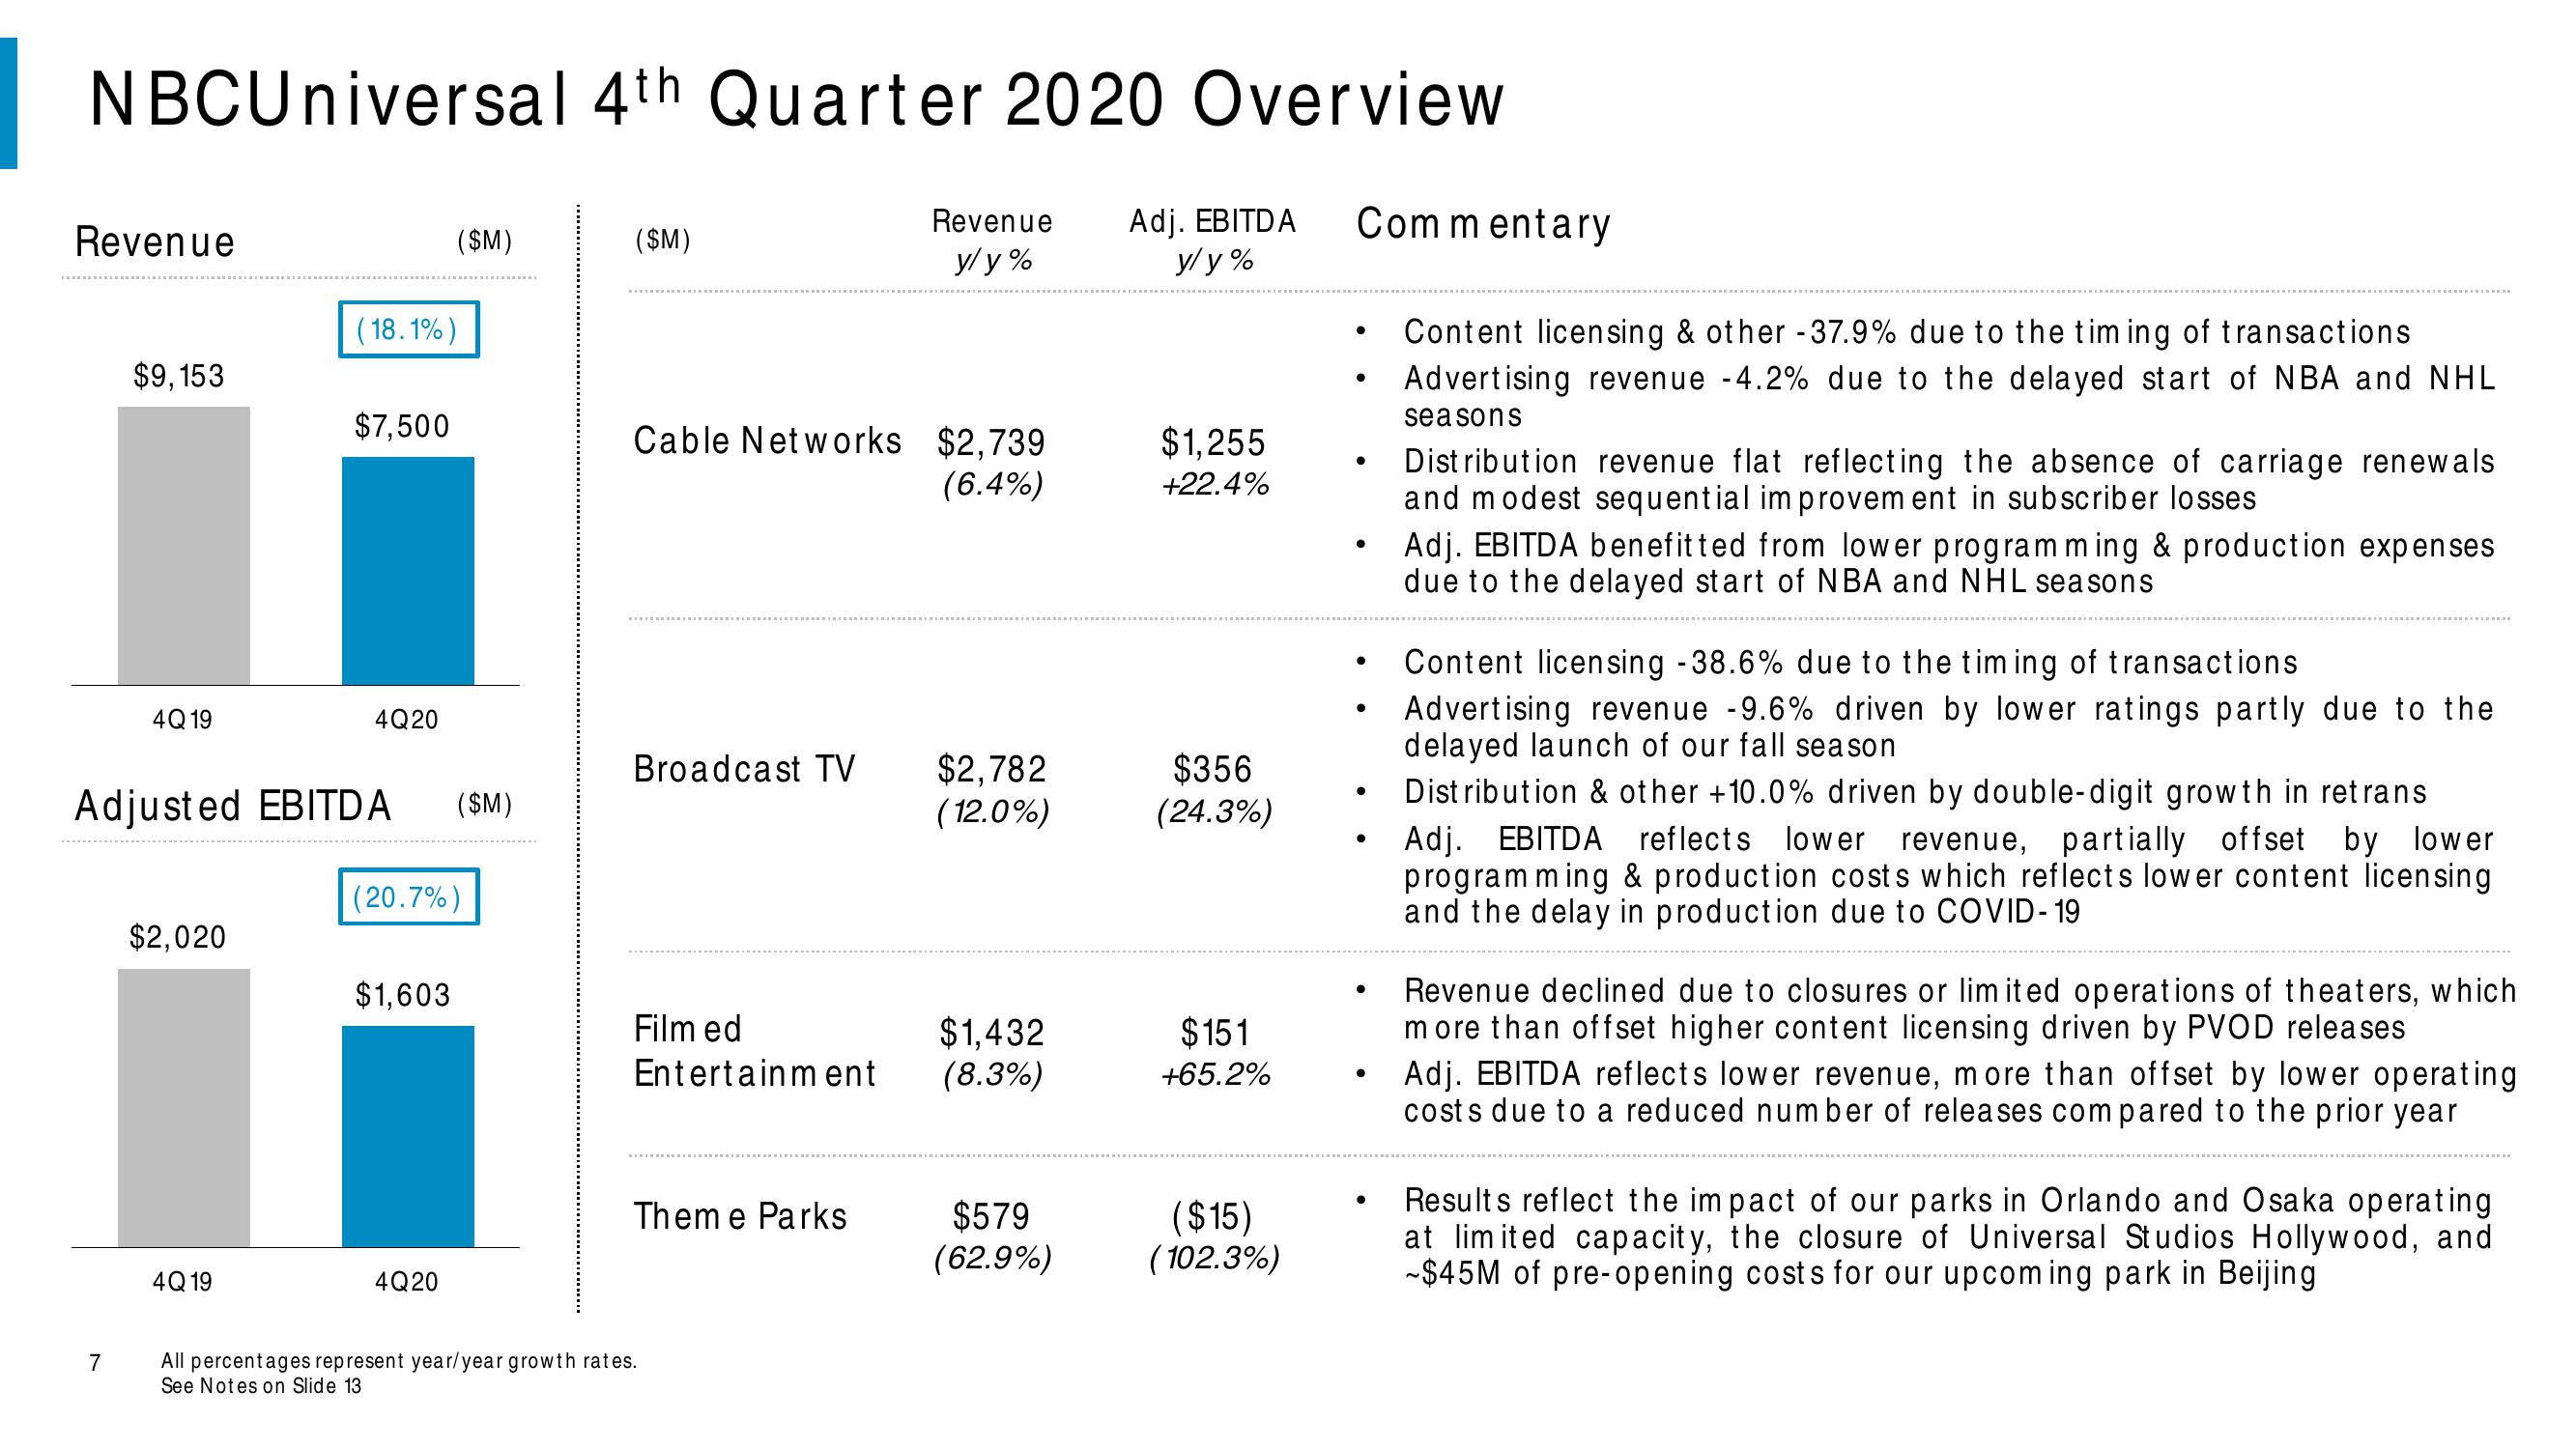
NBCUniversal 4th Quarter 2020 Overview
Revenue
y/y%
Adj. EBITDA
y/y%
Revenue
$9,153
7
4Q 19
$2,020
4Q 19
(18.1%)
$7,500
Adjusted EBITDA ($M)
4Q20
($M)
(20.7%)
$1,603
4Q20
($M)
Cable Networks $2,739
(6.4%)
Broadcast TV
Film ed
Entertainment
Theme Parks
All percentages represent year/year growth rates.
See Notes on Slide 13
$2,782
(12.0%)
$1,432
(8.3%)
$579
(62.9%)
$1,255
+22.4%
$356
(24.3%)
$151
+65.2%
($15)
(102.3%)
Commentary
●
●
●
●
●
●
●
●
●
●
Content licensing & other -37.9% due to the timing of transactions
Advertising revenue -4.2% due to the delayed start of NBA and NHL
seasons
Distribution revenue flat reflecting the absence of carriage renewals
and modest sequential improvement in subscriber losses
Adj. EBITDA benefitted from lower programming & production expenses
due to the delayed start of NBA and NHL seasons
Content licensing -38.6% due to the timing of transactions
Advertising revenue -9.6% driven by lower ratings partly due to the
delayed launch of our fall season
Distribution & other +10.0% driven by double-digit growth in retrans
Adj. EBITDA reflects lower revenue, partially offset by lower
programming & production costs which reflects lower content licensing
and the delay in production due to COVID-19
Revenue declined due to closures or limited operations of theaters, which
more than offset higher content licensing driven by PVOD releases
Adj. EBITDA reflects lower revenue, more than offset by lower operating
costs due to a reduced number of releases compared to the prior year
Results reflect the impact of our parks in Orlando and Osaka operating
at limited capacity, the closure of Universal Studios Hollywood, and
-$45M of pre-opening costs for our upcoming park in BeijingView entire presentation