Telia Company Results Presentation Deck
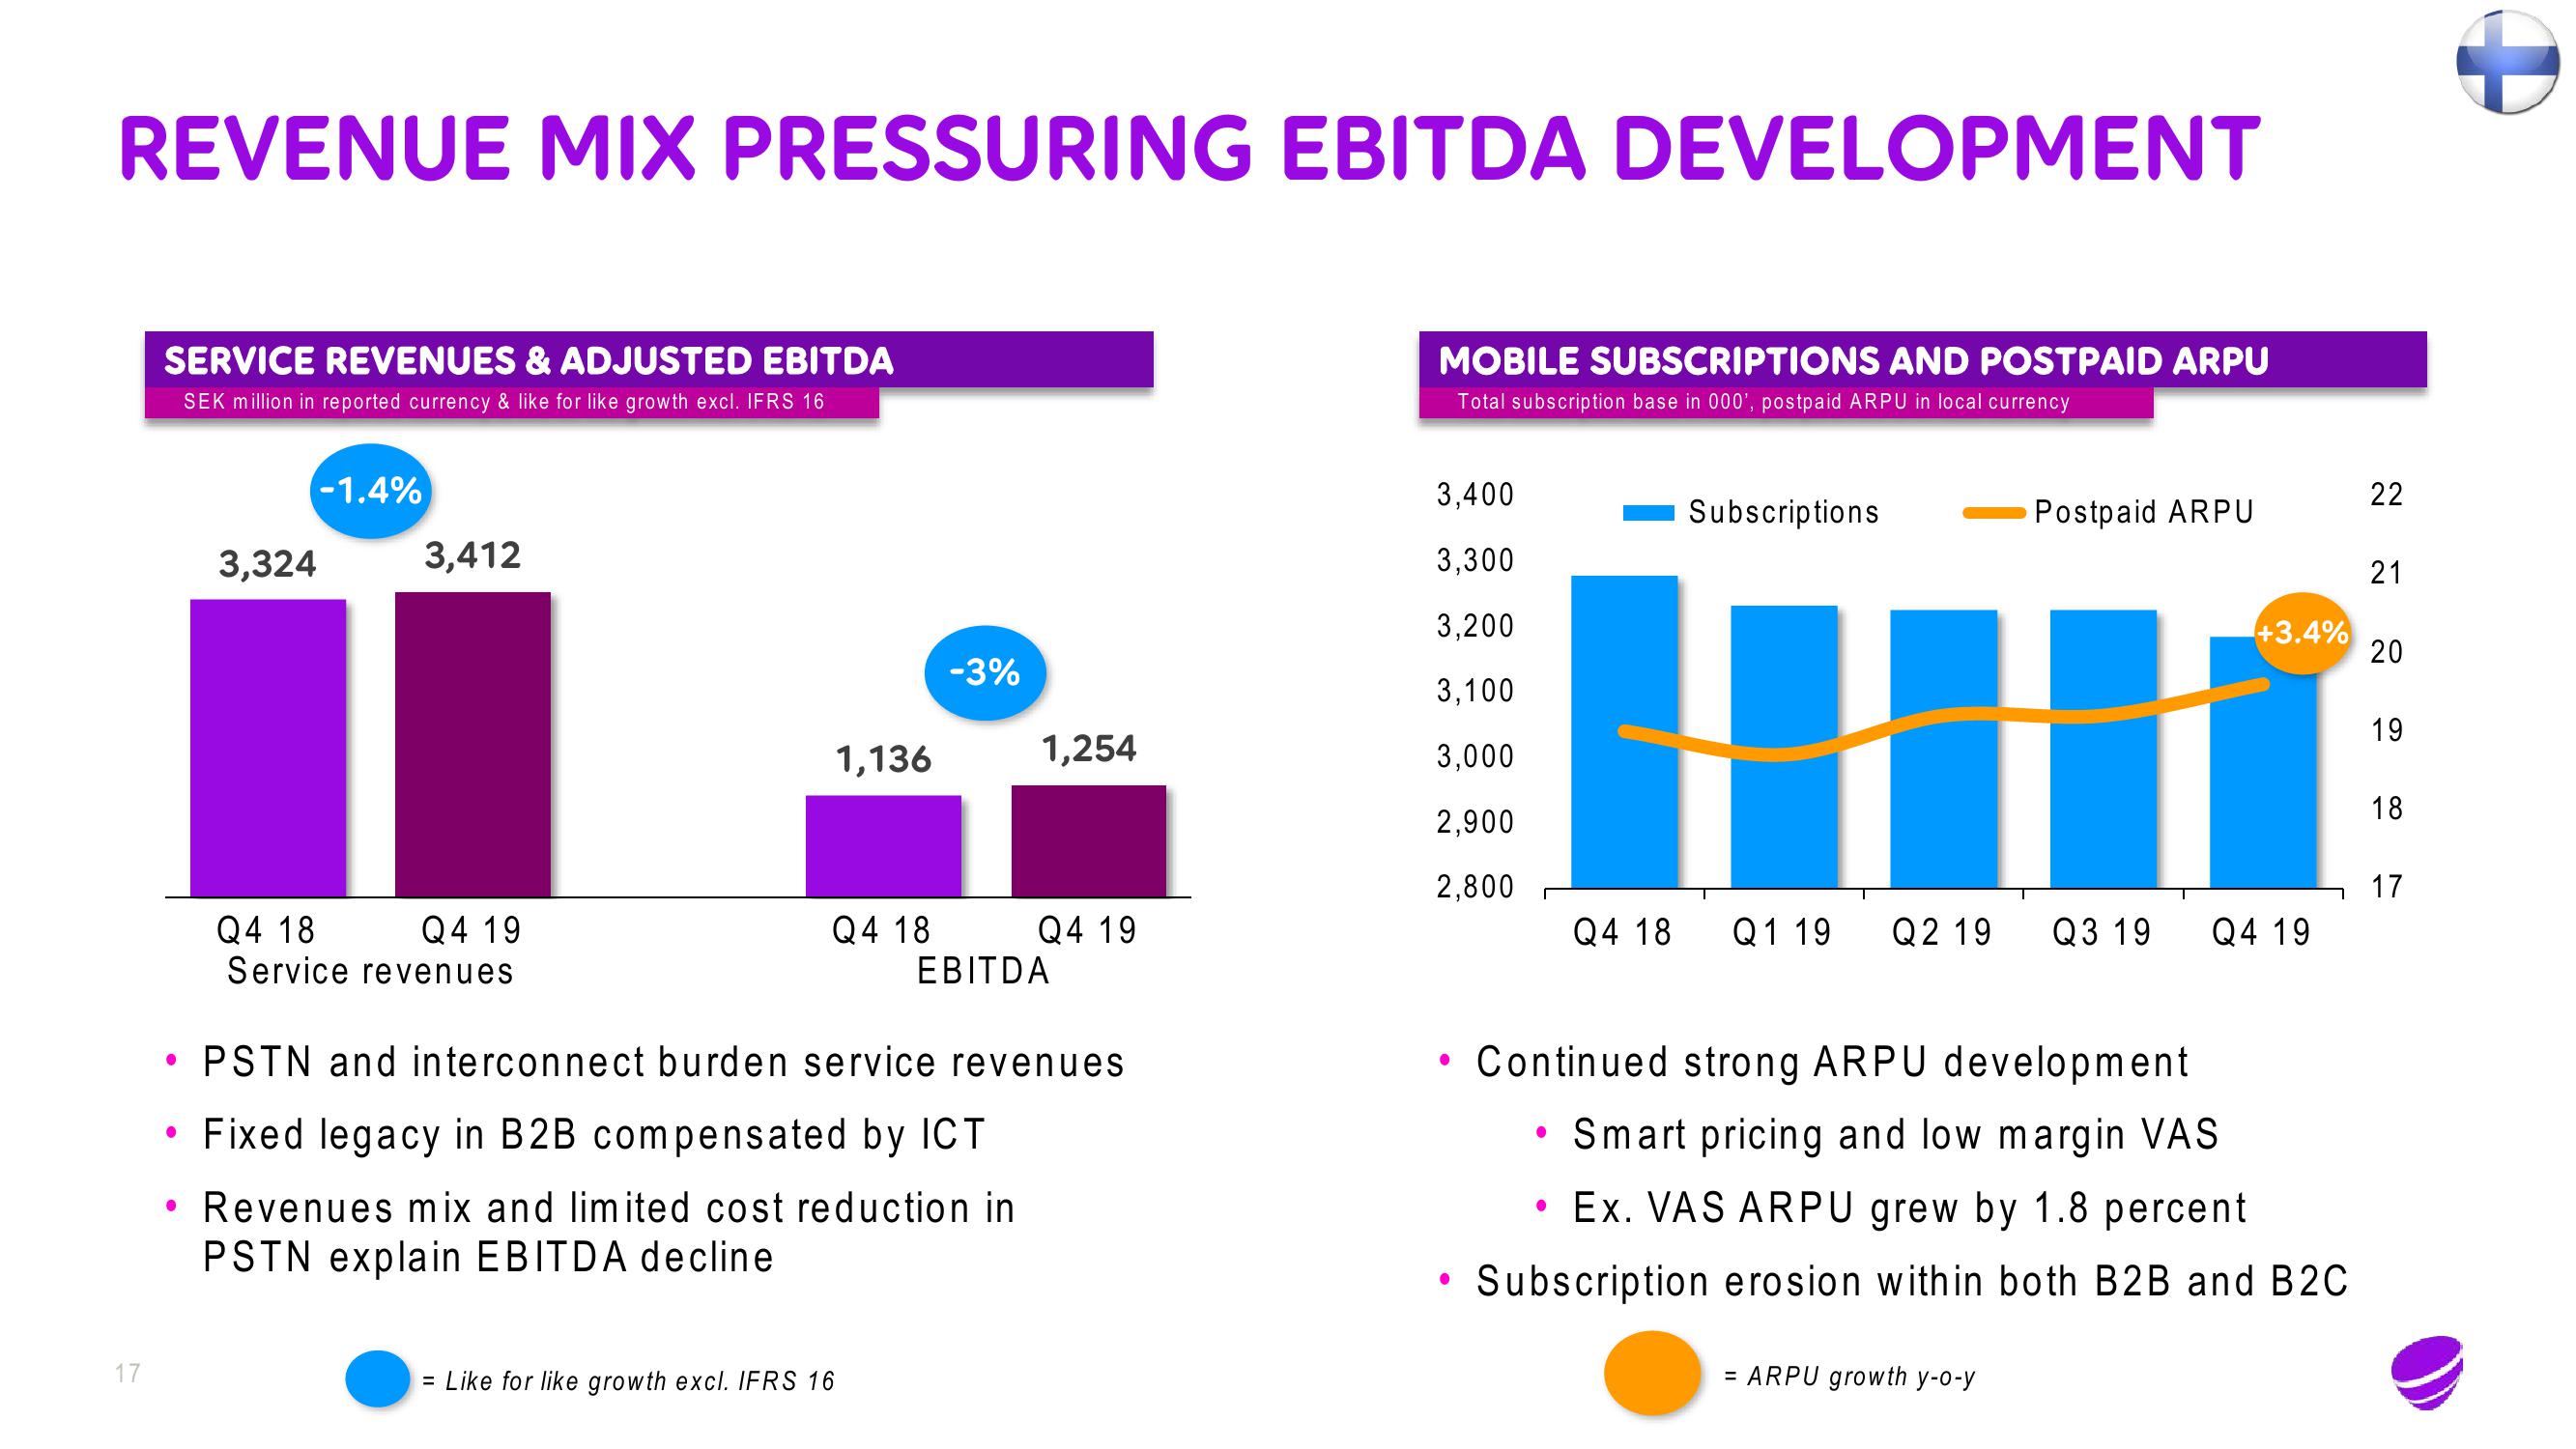
REVENUE MIX PRESSURING EBITDA DEVELOPMENT
17
SERVICE REVENUES & ADJUSTED EBITDA
SEK million in reported currency & like for like growth excl. IFRS 16
-1.4%
●
3,324
3,412
Q4 18
Q4 19
Service revenues
1,136
-3%
= Like for like growth excl. IFRS 16
1,254
Q4 18
EBITDA
Q4 19
• PSTN and interconnect burden service revenues
Fixed legacy in B2B compensated by ICT
• Revenues mix and limited cost reduction in
PSTN explain EBITDA decline
MOBILE SUBSCRIPTIONS AND POSTPAID ARPU
Total subscription base in 000', postpaid ARPU in local currency
3,400
3,300
3,200
3,100
3,000
2,900
2,800
●
●
Subscriptions
●
H
Q4 18 Q1 19 Q2 19
Postpaid ARPU
= ARPU growth y-o-y
Q3 19
+3.4%
Continued strong ARPU development
Smart pricing and low margin VAS
• Ex. VAS ARPU grew by 1.8 percent
●
Subscription erosion within both B2B and B2C
Q4 19
22
21
20
19
18
17View entire presentation