Goldman Sachs Results Presentation Deck
Expenses
$ in millions
Compensation and benefits $
Transaction based
Market development
Communications and technology
Depreciation and amortization
Occupancy
Professional fees
Other expenses
Total operating expenses $
Provision for taxes $
Effective Tax Rate
Financial Results
2Q23
3,619
1,385
146
482
1,594
253
392
673
8,544
520
VS.
1Q23
(12)%
(1)%
(15)%
3%
64%
(5)%
2%
3%
2%
(31)%
VS.
2Q22
(2)%$
5%
(38)%
9%
180%
(2)%
(20)%
5%
12% $
(16)% $
2Q23
YTD
7,709
2,790
318
948
2,564
518
775
1,324
16,946
1,279
22.3%
VS.
2Q22
YTD
(1)%
9%
(20)%
9%
141%
2%
(16)%
5%
10%
(4)%
6.Opp
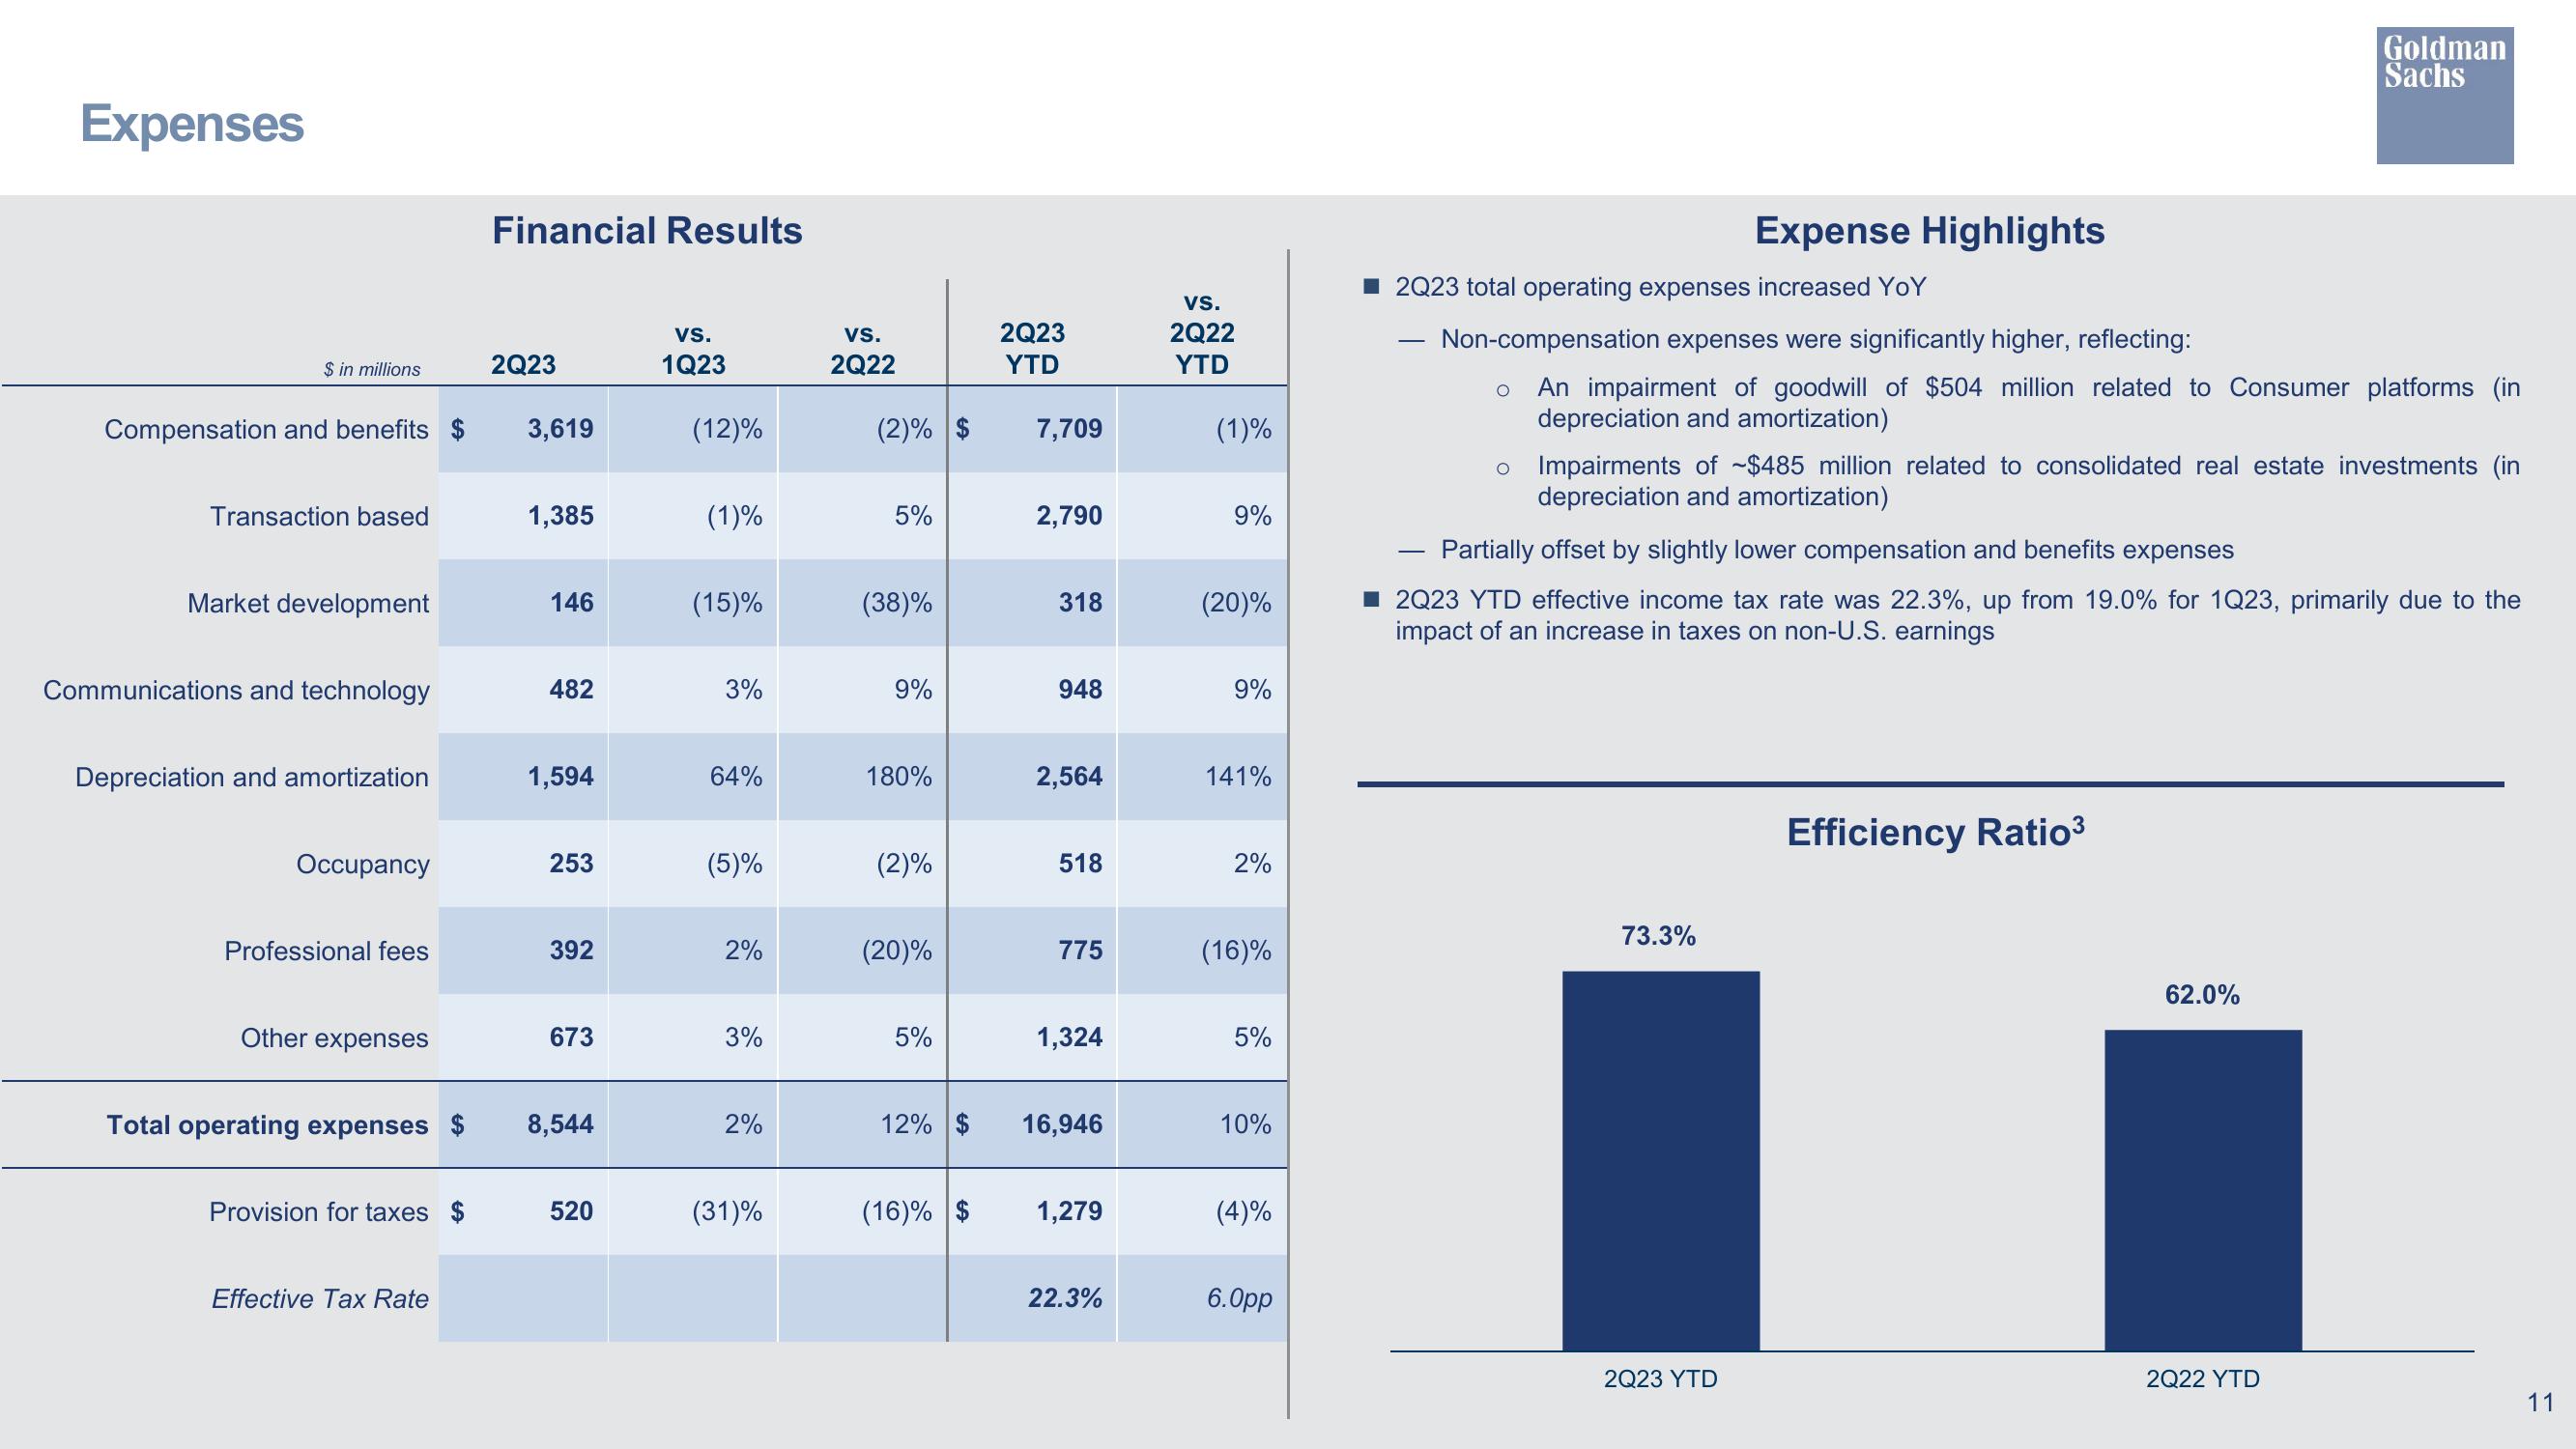
■2Q23 total operating expenses increased YoY
Expense Highlights
Non-compensation expenses were significantly higher, reflecting:
O An impairment of goodwill of $504 million related to Consumer platforms (in
depreciation and amortization)
O Impairments of ~$485 million related to consolidated real estate investments (in
depreciation and amortization)
73.3%
Partially offset by slightly lower compensation and benefits expenses
2Q23 YTD effective income tax rate was 22.3%, up from 19.0% for 1Q23, primarily due to the
impact of an increase in taxes on non-U.S. earnings
2Q23 YTD
Goldman
Sachs
Efficiency Ratio³
62.0%
2Q22 YTD
11View entire presentation