Bank of America Results Presentation Deck
Balance Sheet Transformation Highlights
(EOP basis unless noted)
Metric
Total loans and leases¹
% consumer
Consumer credit card
Home equity
GWIM loans
Commercial real estate
of which Construction (%)
Nonperforming loans
NCOS¹
Nine-quarter stressed net
credit losses²
Tangible common
shareholders' equity¹,³
4Q09
$1,003B
67%
$161B
$154B
$100B
$69B
39%
3.75%
$11B
$104B / 10.0%
$112B
4Q19
$214B
$983B
47%
$98B
$41B
$177B
$63B
12%
0.36%
$959MM
$44B / 4.4%
$172B
3Q22
$576B
$1,032B
44%
$87B
$27B
$225B
$68B
14%
0.39%
$520MM
$53B / 5.2%
$170B
$941B
Transformation through Responsible Growth
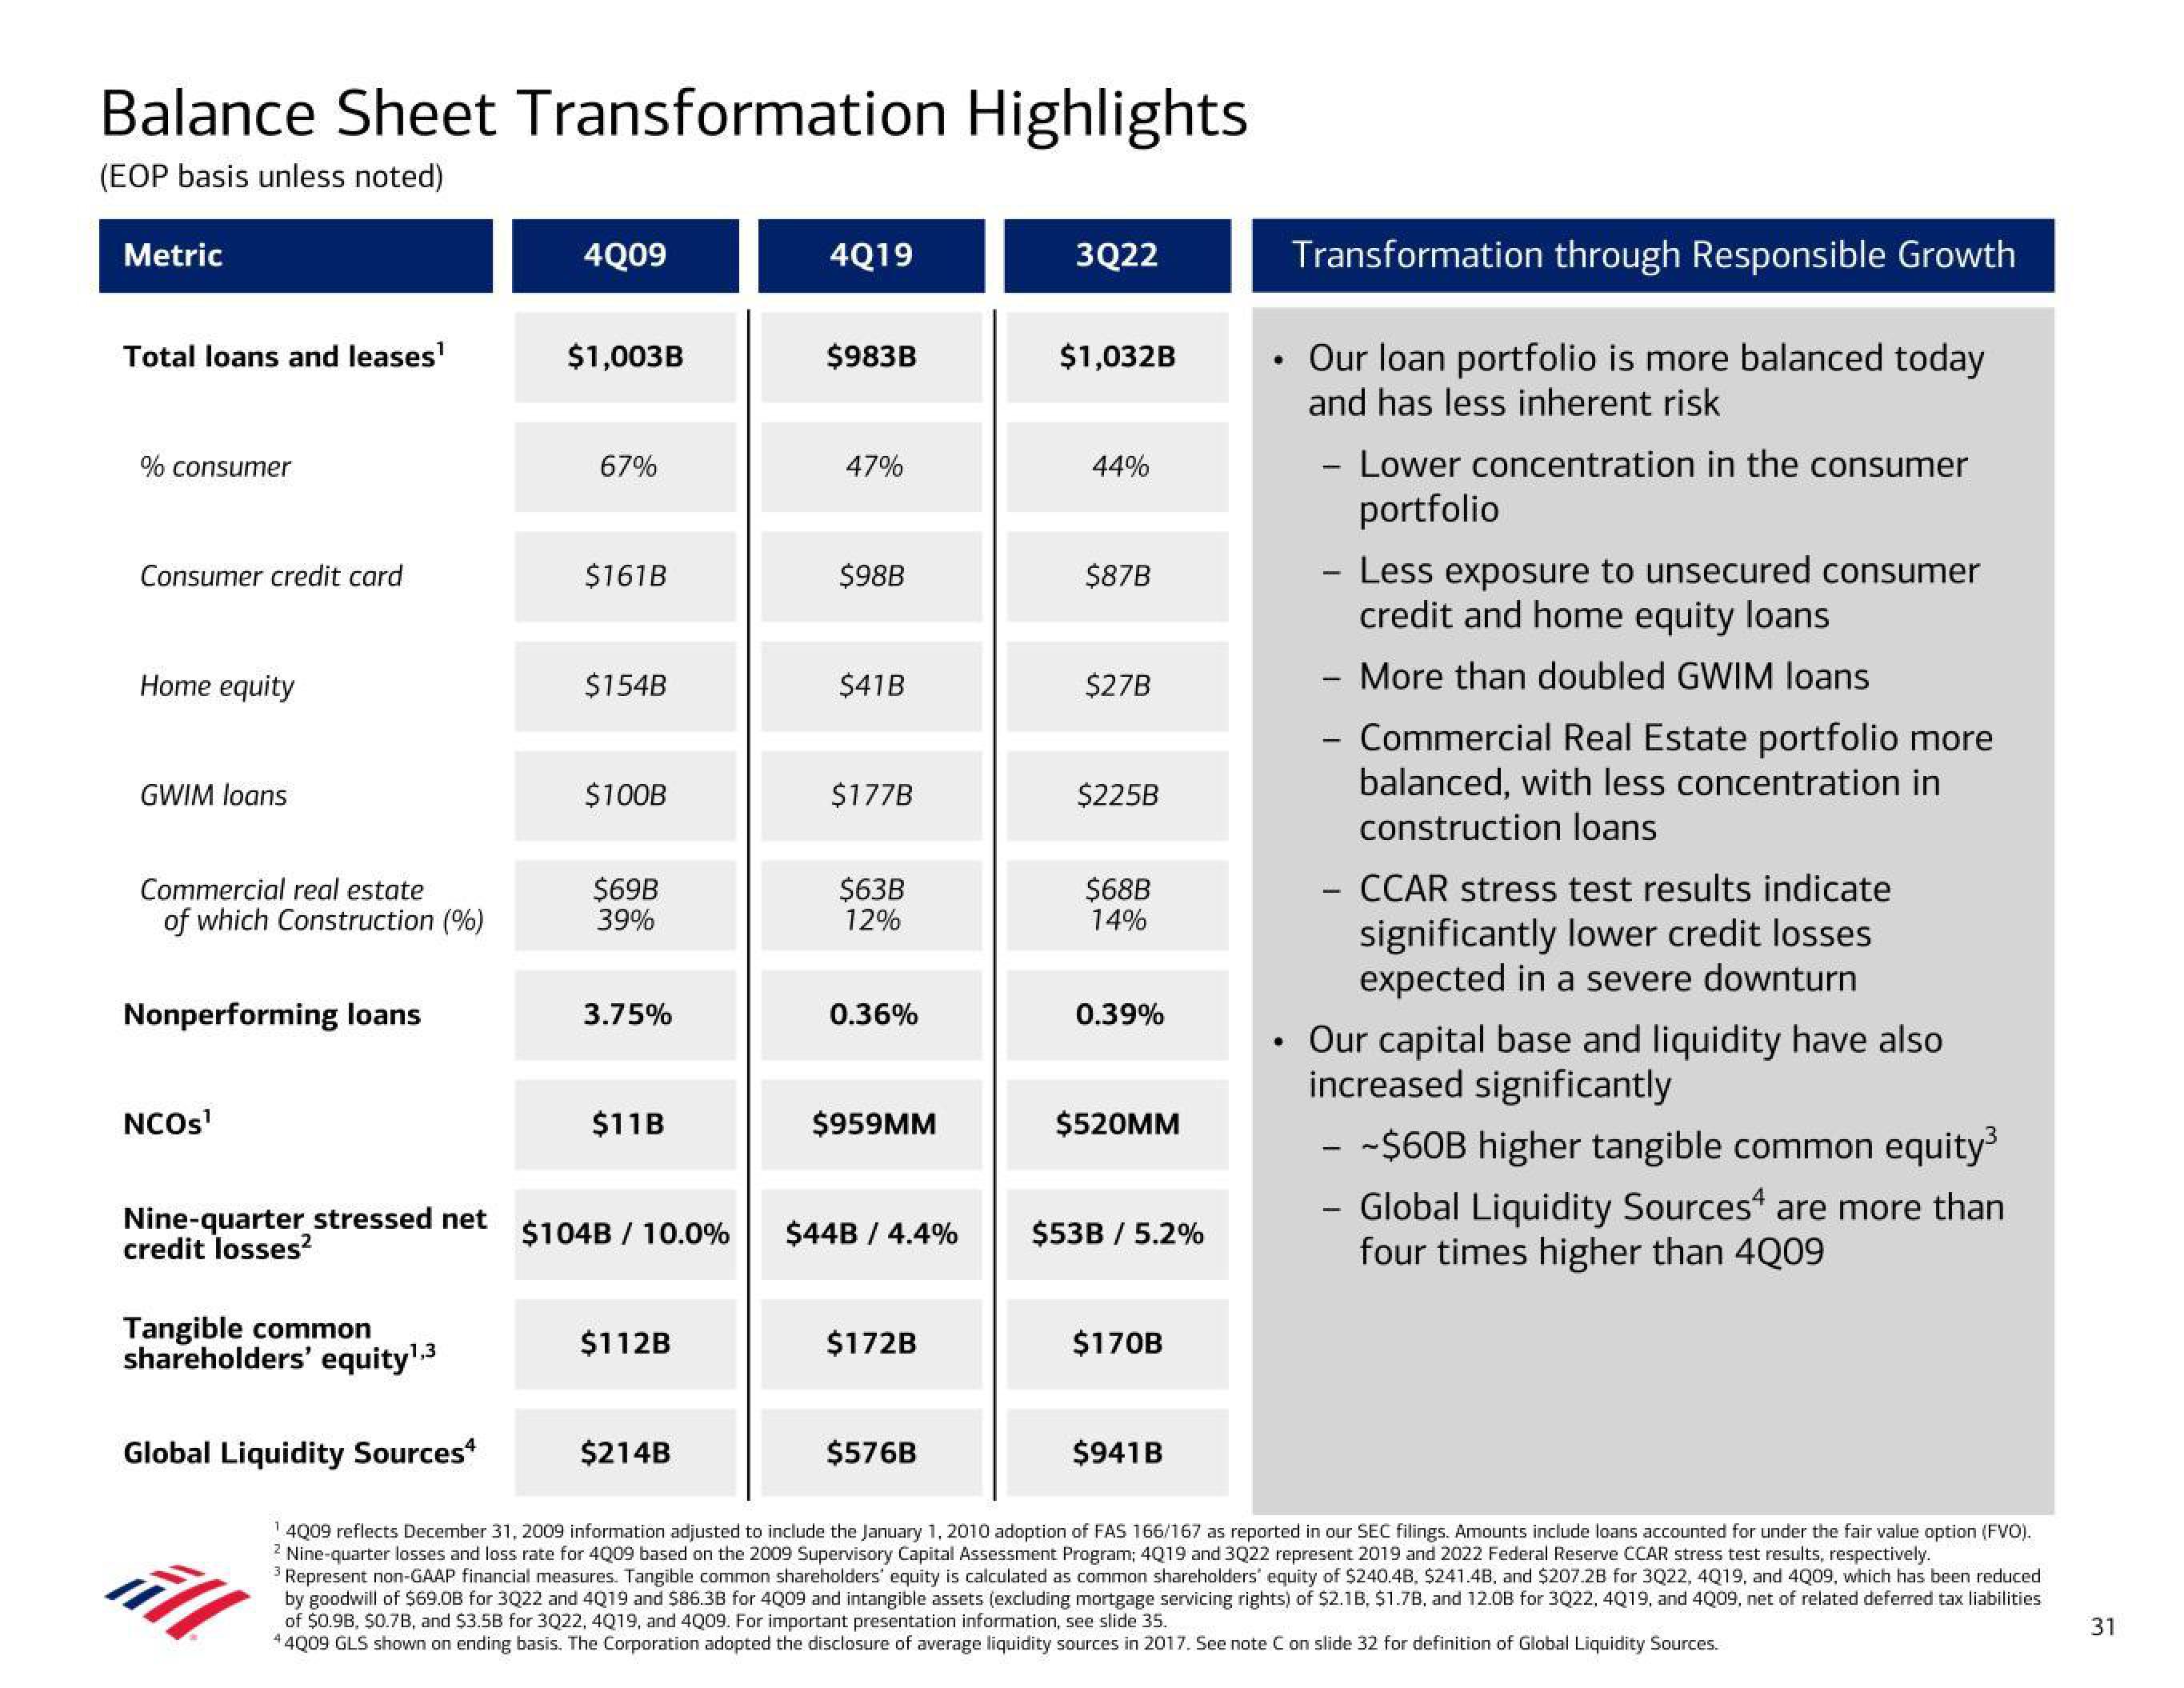
• Our loan portfolio is more balanced today
and has less inherent risk
-
Lower concentration in the consumer
portfolio
- Less exposure to unsecured consumer
credit and home equity loans
- More than doubled GWIM loans
Commercial Real Estate portfolio more
balanced, with less concentration in
construction loans
- CCAR stress test results indicate
significantly lower credit losses
expected in a severe downturn
Our capital base and liquidity have also
increased significantly
-
Global Liquidity Sources*
¹4009 reflects December 31, 2009 information adjusted to include the January 1, 2010 adoption of FAS 166/167 as reported in our SEC filings. Amounts include loans accounted for under the fair value option (FVO).
2 Nine-quarter losses and loss rate for 4009 based on the 2009 Supervisory Capital Assessment Program; 4Q19 and 3Q22 represent 2019 and 2022 Federal Reserve CCAR stress test results, respectively.
3 Represent non-GAAP financial measures. Tangible common shareholders' equity is calculated as common shareholders' equity of $240.4B, $241.4B, and $207.2B for 3Q22, 4019, and 4Q09, which has been reduced
by goodwill of $69.0B for 3Q22 and 4Q19 and $86.3B for 4009 and intangible assets (excluding mortgage servicing rights) of $2.1B, $1.7B, and 12.0B for 3Q22, 4Q19, and 4009, net of related deferred tax liabilities
of $0.9B, $0.7B, and $3.5B for 3Q22, 4019, and 4Q09. For important presentation information, see slide 35.
44Q09 GLS shown on ending basis. The Corporation adopted the disclosure of average liquidity sources in 2017. See note C on slide 32 for definition of Global Liquidity Sources.
- ~$60B higher tangible common equity³
Global Liquidity Sources are more than
four times higher than 4Q09
31View entire presentation