Unilever Results Presentation Deck
Unilever
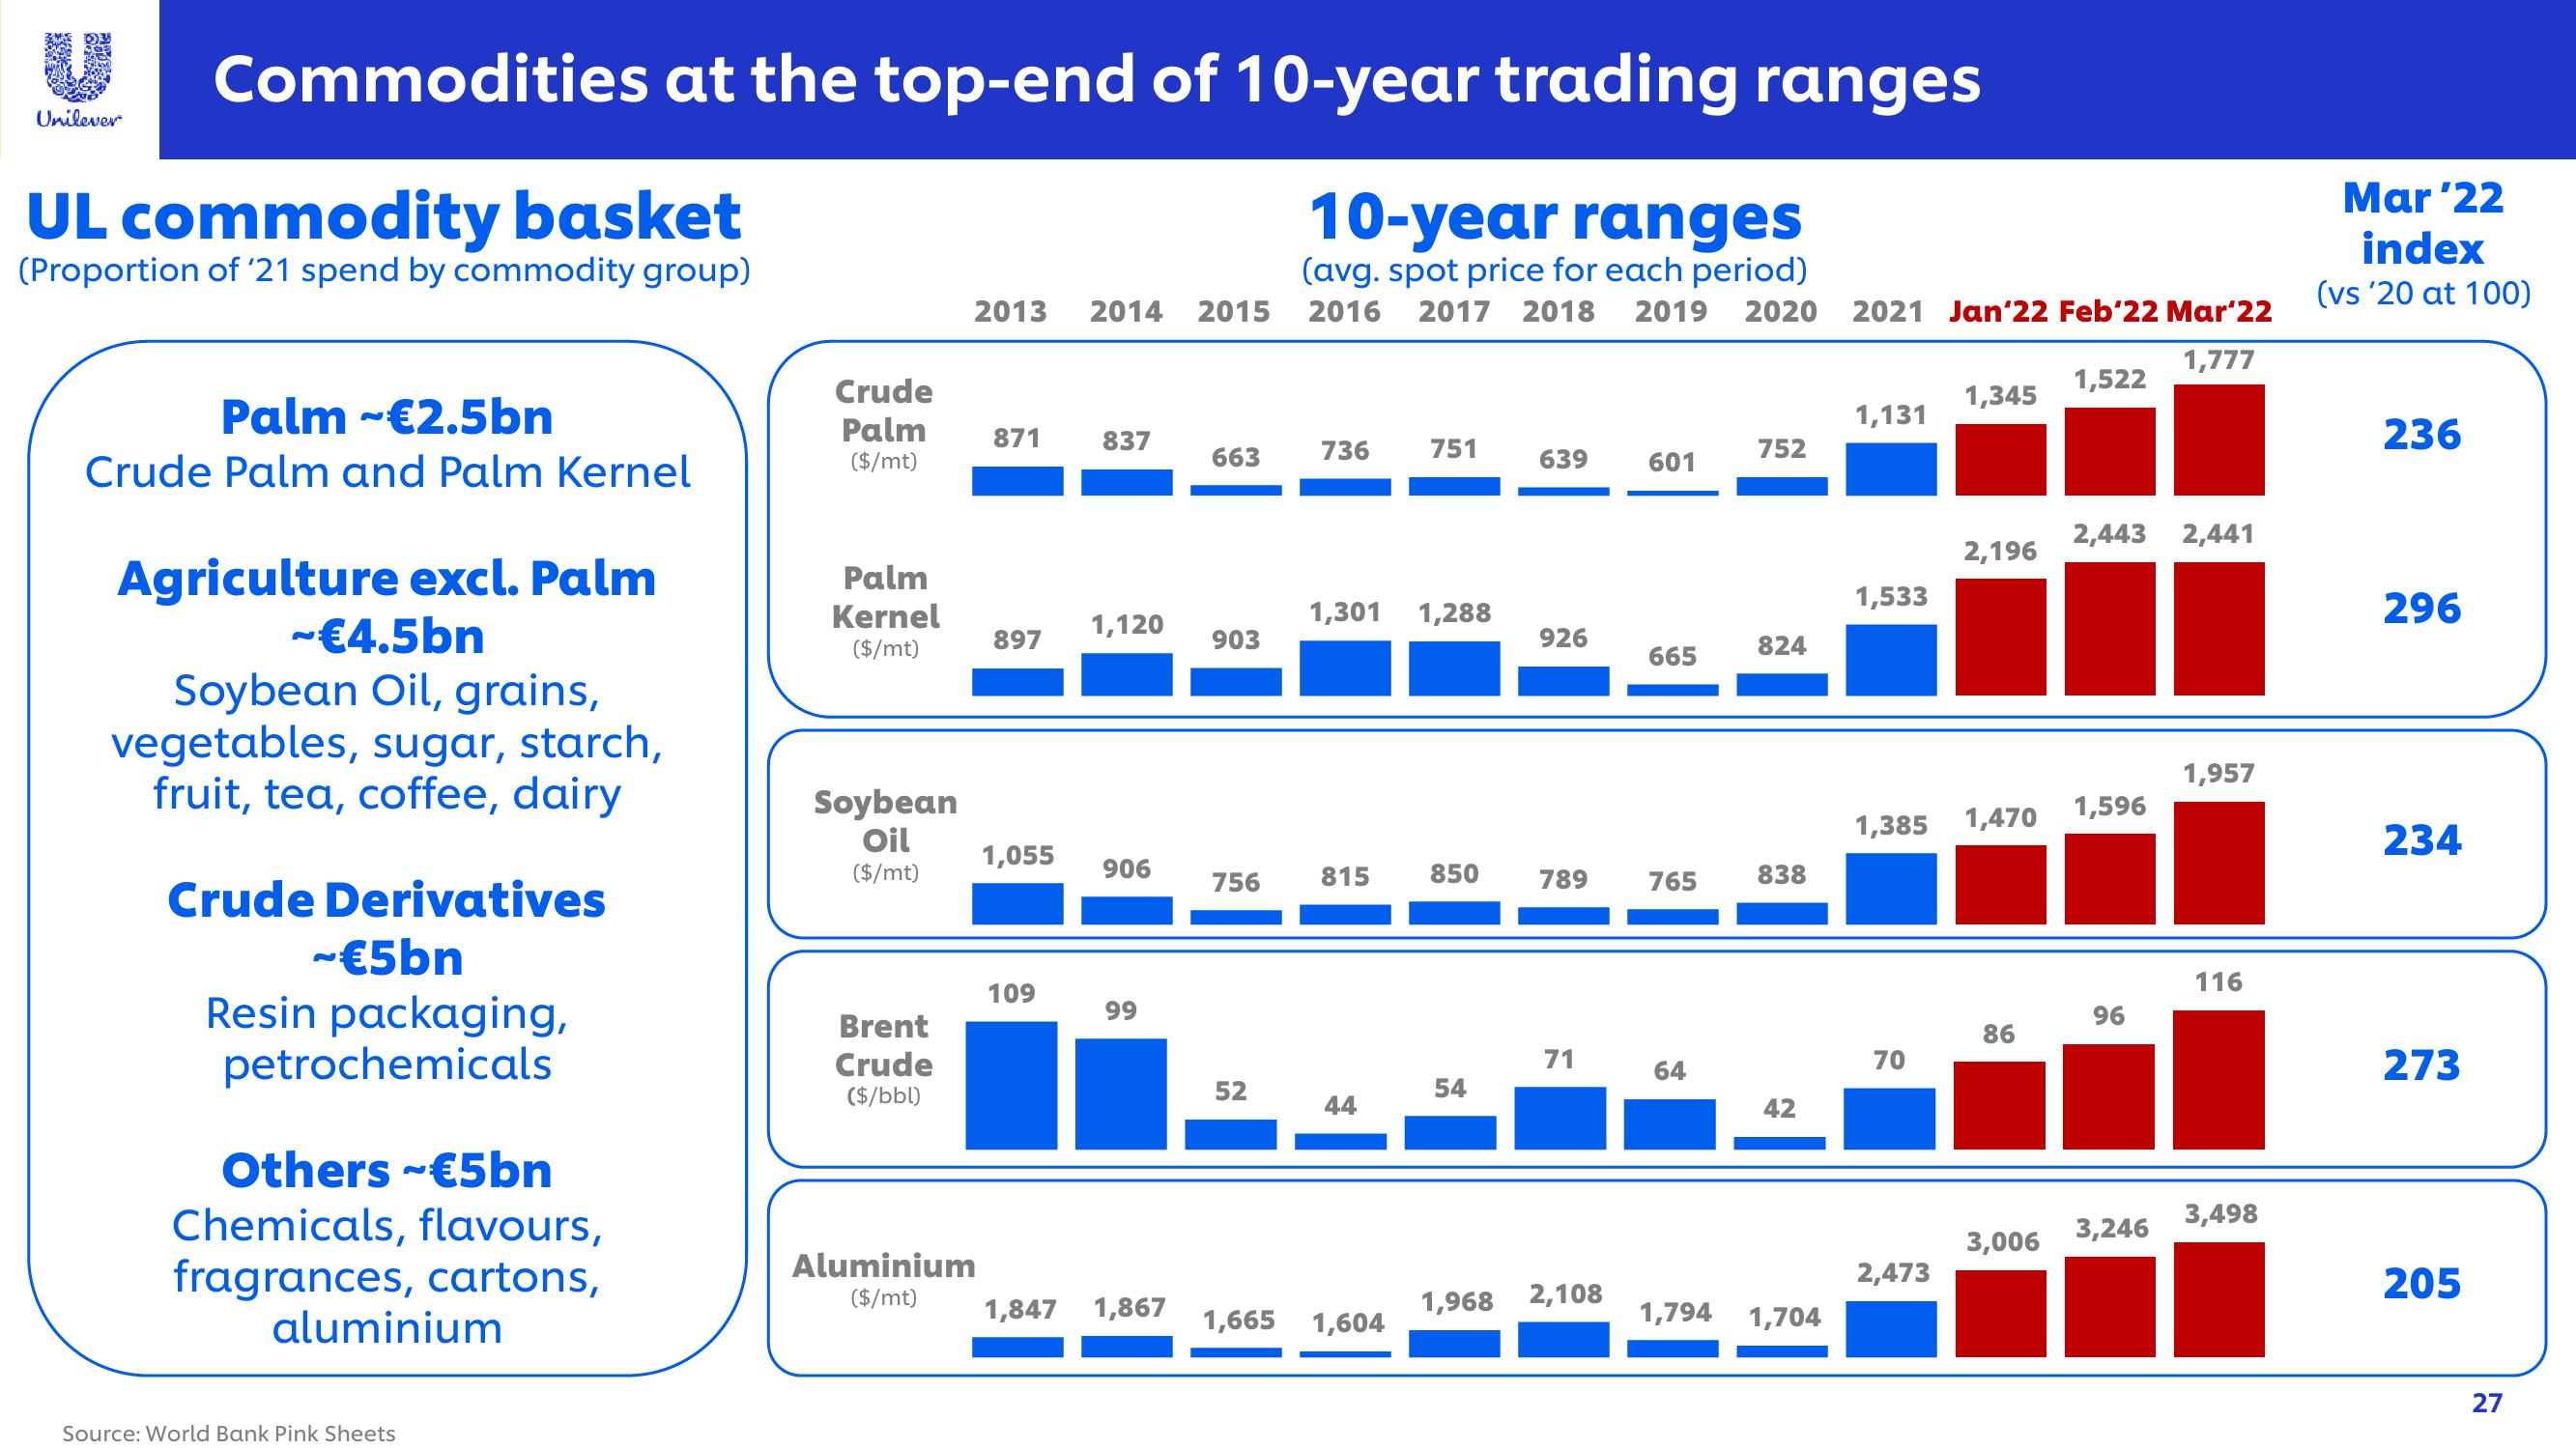
Commodities at the top-end of 10-year trading ranges
10-year ranges
(avg. spot price for each period)
2016 2017 2018 2019 2020 2021 Jan'22 Feb'22 Mar 22
1,777
UL commodity basket
(Proportion of '21 spend by commodity group)
Palm ~€2.5bn
Crude Palm and Palm Kernel
Agriculture excl. Palm
~€4.5bn
Soybean Oil, grains,
vegetables, sugar, starch,
fruit, tea, coffee, dairy
Crude Derivatives
~€5bn
Resin packaging,
petrochemicals
Others ~€5bn
Chemicals, flavours,
fragrances, cartons,
aluminium
Source: World Bank Pink Sheets
Crude
Palm
($/mt)
Palm
Kernel
($/mt)
Soybean
Oil
($/mt)
Brent
Crude
($/bbl)
Aluminium
($/mt)
2013 2014 2015
871
897
1,055
109
1,847
837
1,120
906
99
1,867
663
903
756
52
736
1,301 1,288
815
44
751
1,665 1,604
850
54
1,968
639
926
789
71
2,108
601
665
765
64
1,794
752
824
838
42
1,704
1,131
1,533
70
1,345
1,385 1,470
2,473
2,196
86
1,522
2,443 2,441
1,596
96
1,957
116
3,498
3,246
3,006
Mar '22
index
(vs '20 at 100)
236
296
234
273
205
27View entire presentation