Maersk Investor Presentation Deck
Financial highlights 2020
Strong improvements in profitability driven by all segments
Profit/loss result bridge for 2020, USDm
3,500
3,000
2,500
2,000
1,500
1,000
27
500
0
509
Profit
2019
2,109
Ocean
Annual Report 2020
238
Logistics
&
Services
EBITDA effect
87
Terminals
& Towage
29
Manufac-
turing &
Others
51
-254
131
Unallocated Depreciations, Disposals
activities amortisations,
& elimi-
nations
impairments
70
-121
Net
JV's and
associated financials
companies expenses
51
Tax
2,900
Profit
2020
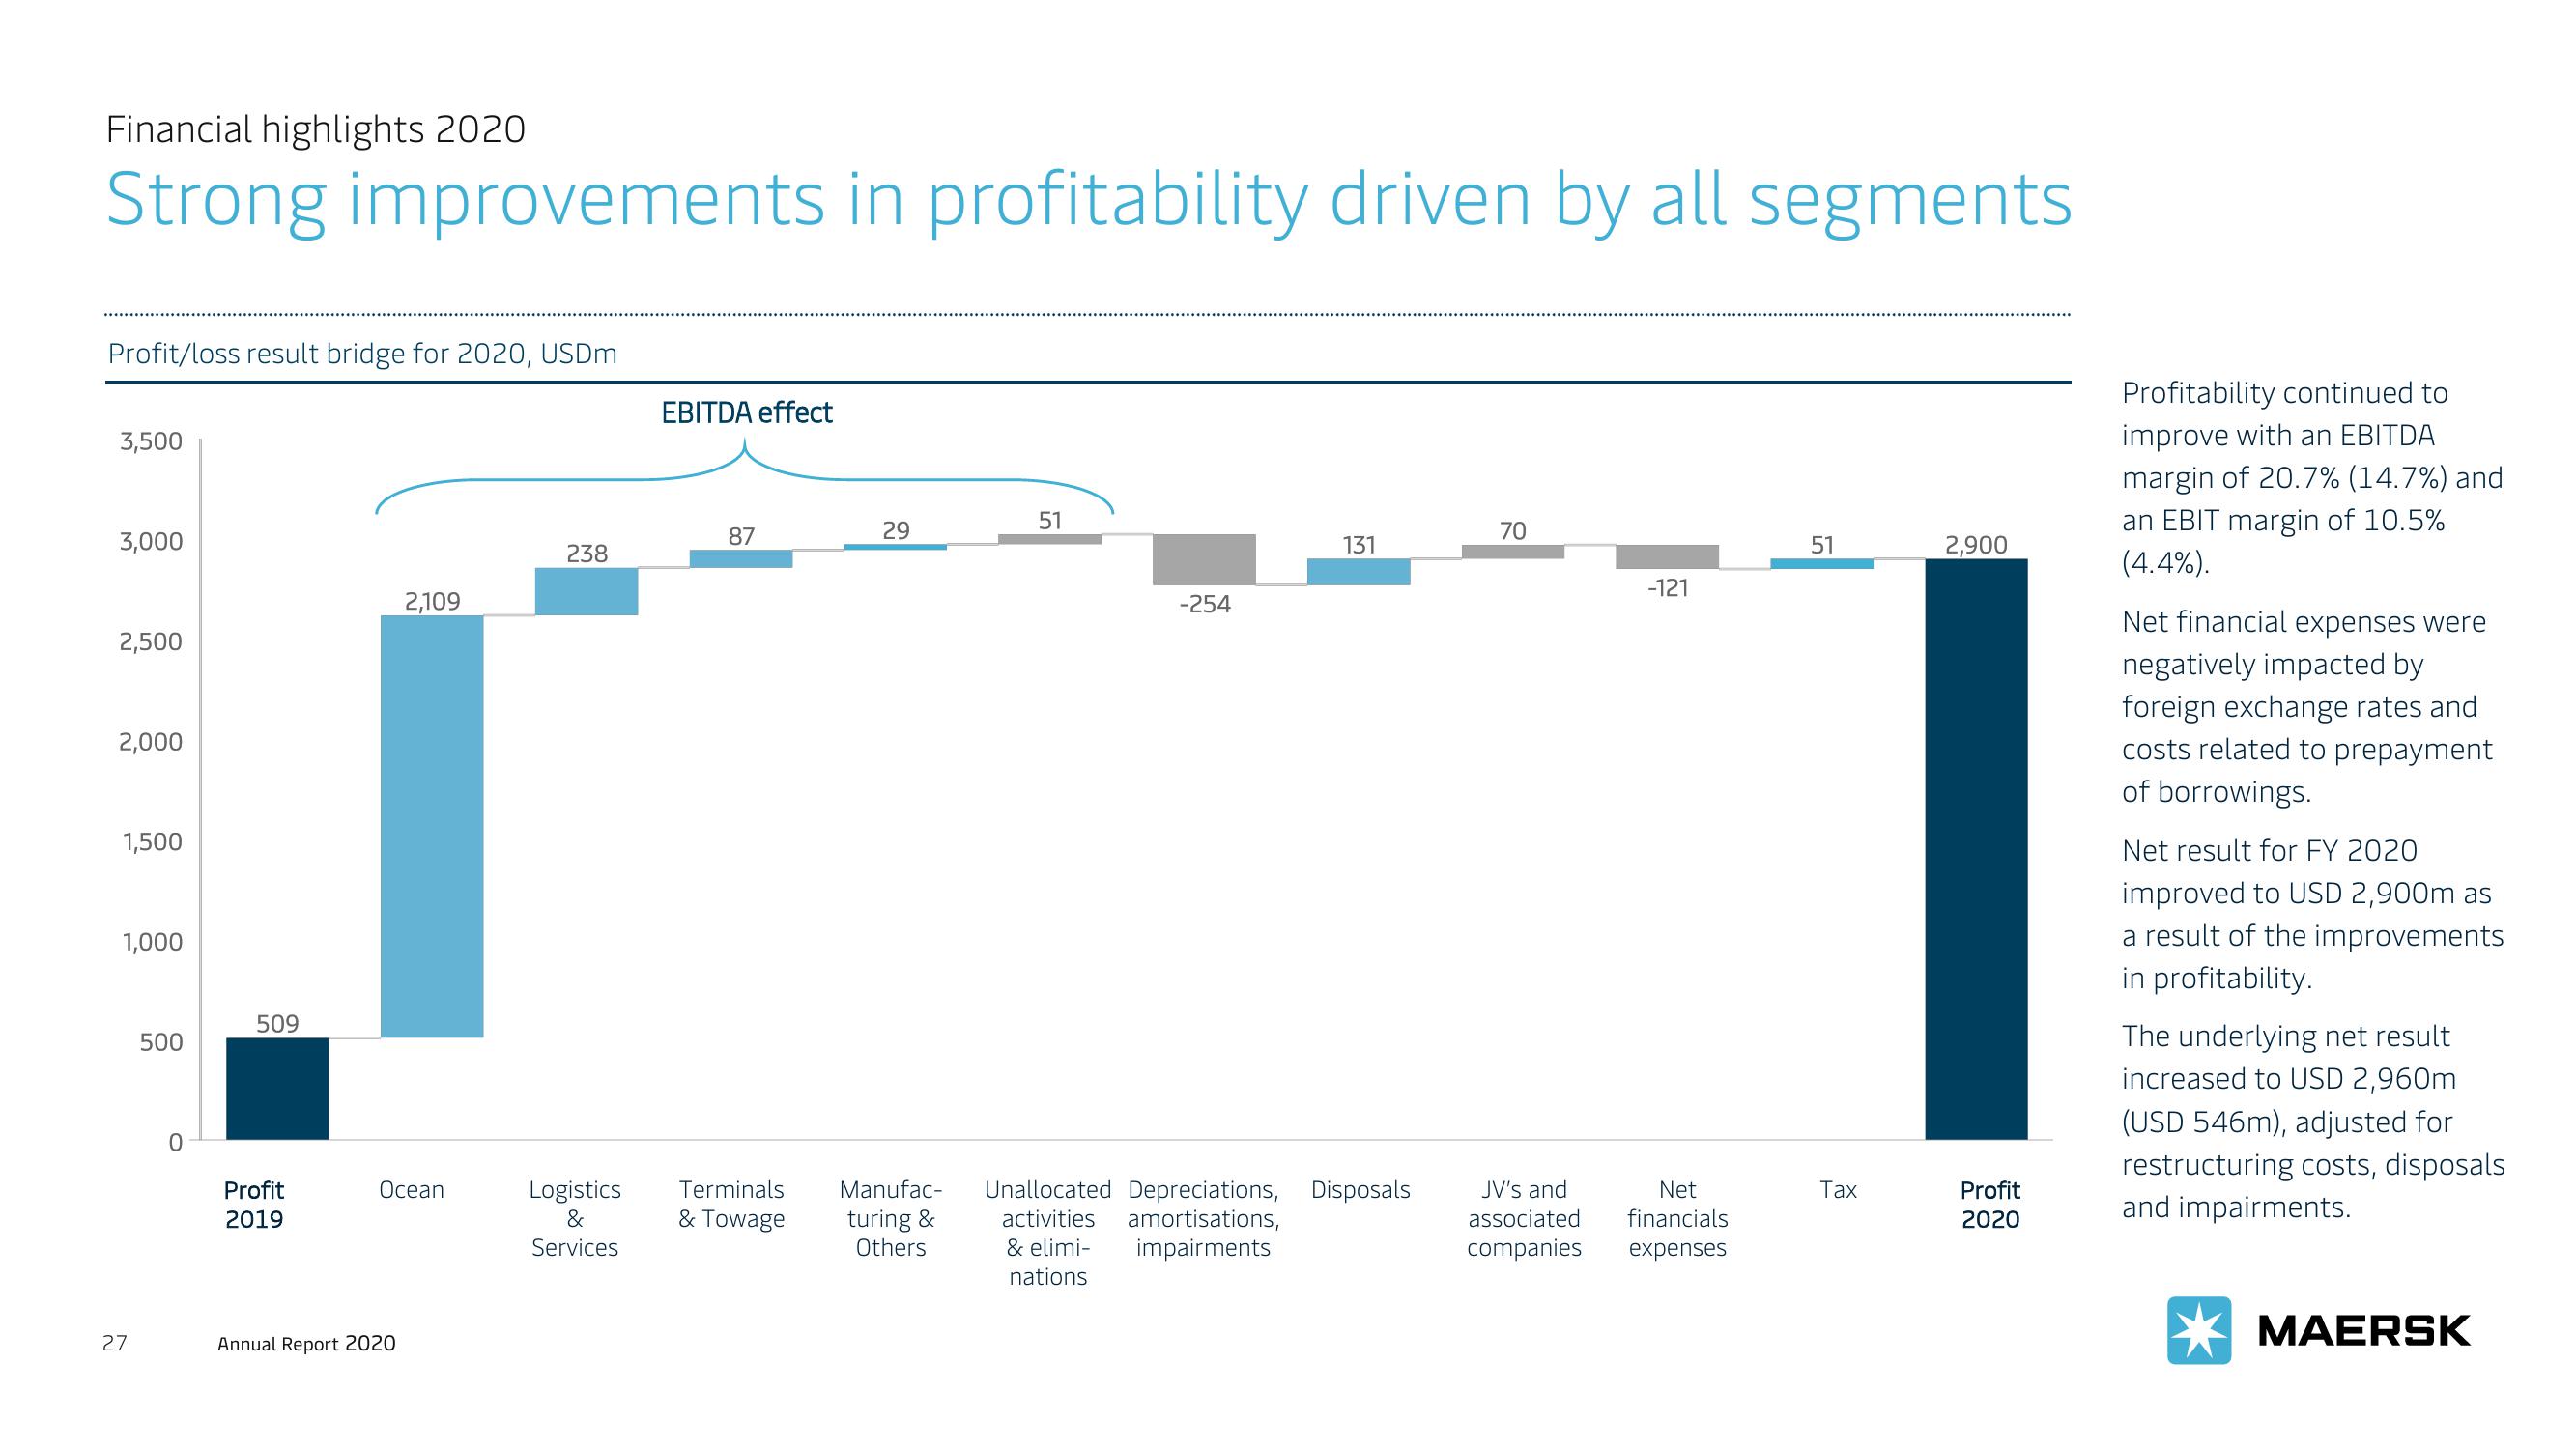
Profitability continued to
improve with an EBITDA
margin of 20.7% (14.7%) and
an EBIT margin of 10.5%
(4.4%).
Net financial expenses were
negatively impacted by
foreign exchange rates and
costs related to prepayment
of borrowings.
Net result for FY 2020
improved to USD 2,900m as
a result of the improvements
in profitability.
The underlying net result
increased to USD 2,960m
(USD 546m), adjusted for
restructuring costs, disposals
and impairments.
MAERSKView entire presentation