Rally SPAC Presentation Deck
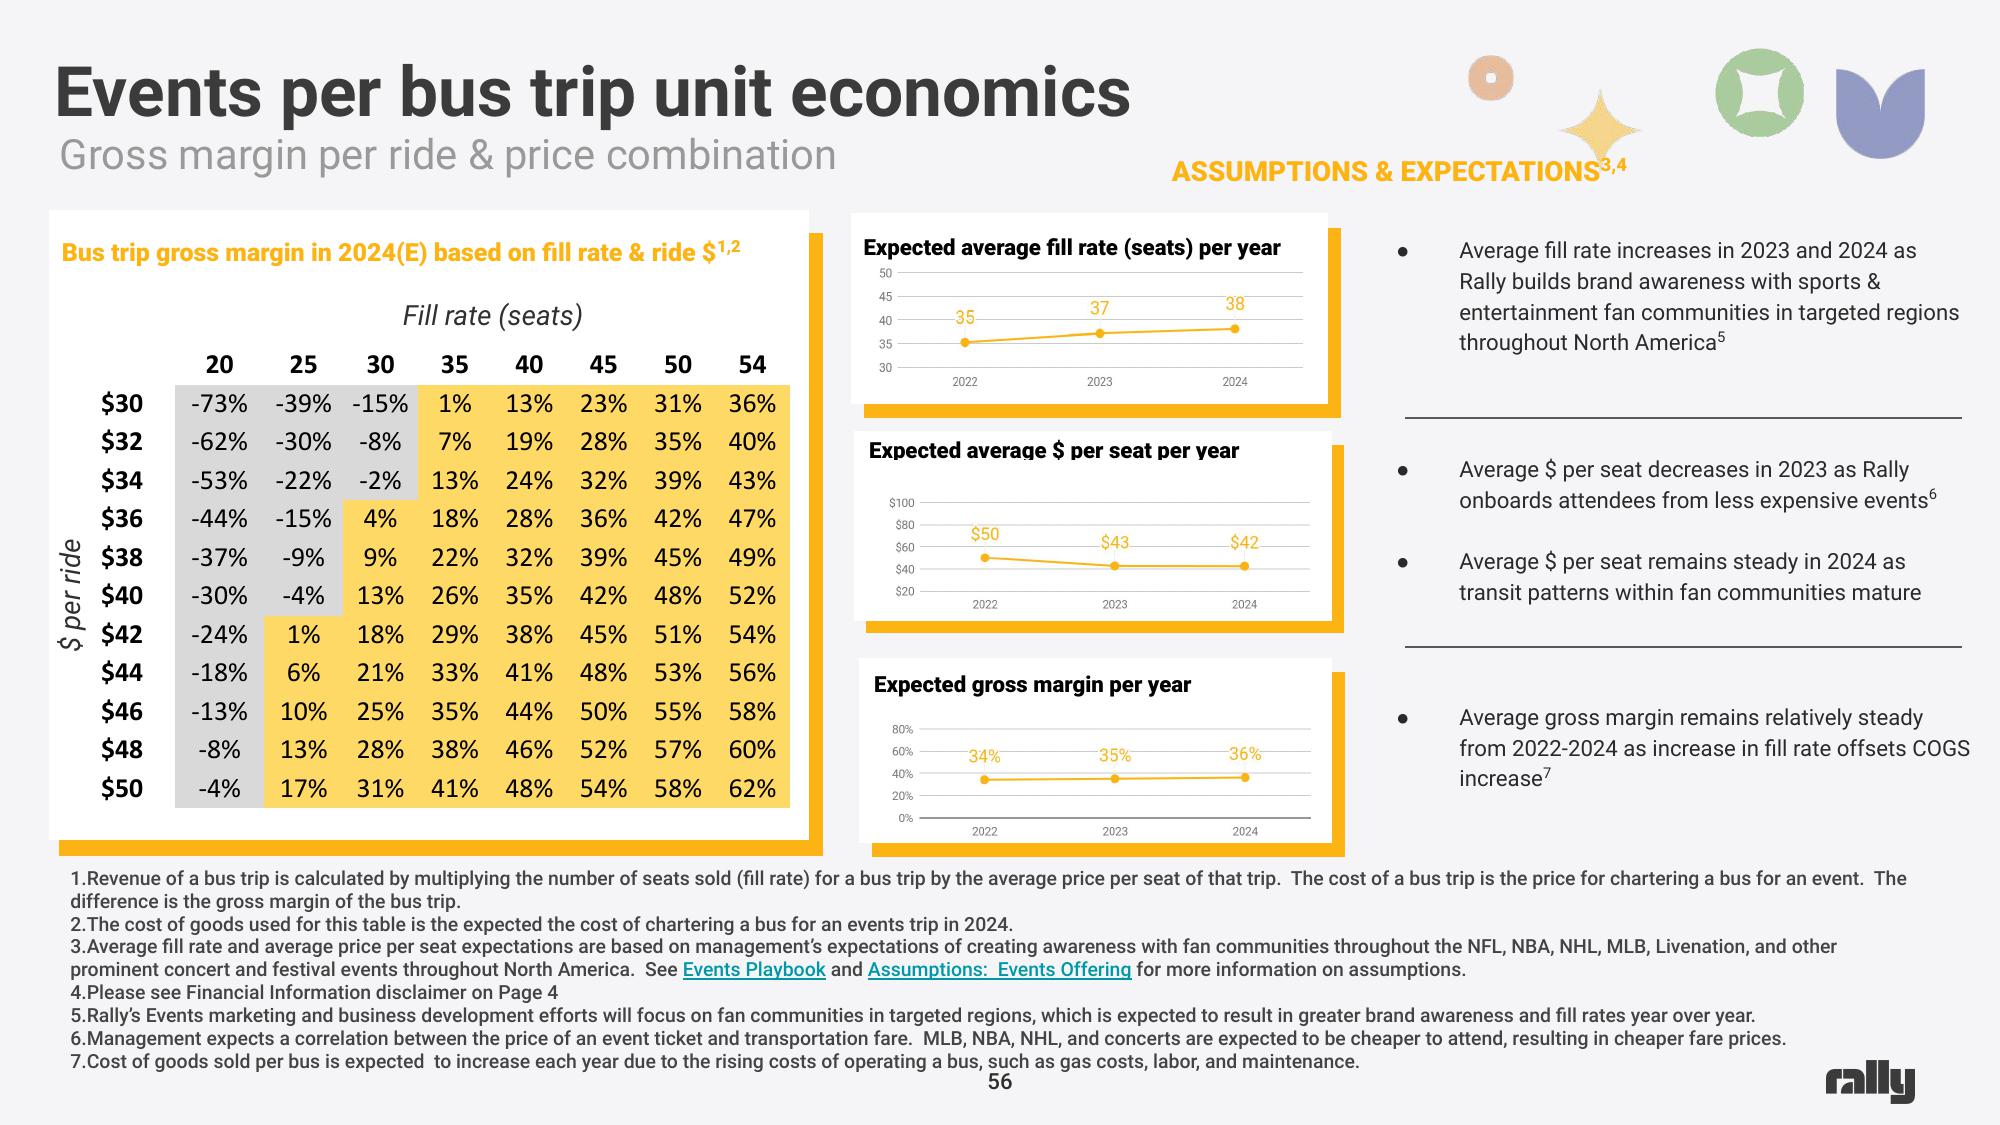
Events per bus trip unit economics
Gross margin per ride & price combination
Bus trip gross margin in 2024(E) based on fill rate & ride $1,2
Fill rate (seats)
-9%
20 25 30 35 40 45 50 54
-73% -39% -15% 1% 13% 23% 31% 36%
-62% -30% -8% 7% 19% 28% 35% 40%
-53% -22% -2% 13% 24% 32% 39% 43%
-15% 4% 18% 28% 36% 42% 47%
9% 22% 32% 39% 45% 49%
13% 26% 35% 42% 48% 52%
18% 29% 38% 45% 51% 54%
6% 21% 33% 41% 48% 53% 56%
-13% 10% 25% 35% 44% 50% 55% 58%
-8% 13% 28% 38% 46% 52% 57% 60%
41% 48% 54% 58% 62%
-4%
1%
-4% 17% 31%
$ per ride
$30
$32
$34
$36 -44%
$38 -37%
$40
-30%
$42 -24%
$44 -18%
$46
$48
$50
Expected average fill rate (seats) per year
50
45
40
35
30
$100
$80
$60
$40
$20
-35-
•
2022
80%
60%
40%
20%
0%
$50
2022
Expected average $ per seat per year
37
•
34%
2023
2022
$43
Expected gross margin per year
2023
ASSUMPTIONS & EXPECTATIONS3,4
35%
2023
38
2024
$42
•
2024
-36%
2024
●
●
●
Average fill rate increases in 2023 and 2024 as
Rally builds brand awareness with sports &
entertainment fan communities in targeted regions
throughout North America5
Average $ per seat decreases in 2023 as Rally
onboards attendees from less expensive events
Average $ per seat remains steady in 2024 as
transit patterns within fan communities mature
Average gross margin remains relatively steady
from 2022-2024 as increase in fill rate offsets COGS
increase7
1.Revenue of a bus trip is calculated by multiplying the number of seats sold (fill rate) for a bus trip by the average price per seat of that trip. The cost of a bus trip is the price for chartering a bus for an event. The
difference is the gross margin of the bus trip.
2. The cost of goods used for this table is the expected the cost of chartering a bus for an events trip in 2024.
3.Average fill rate and average price per seat expectations are based on management's expectations of creating awareness with fan communities throughout the NFL, NBA, NHL, MLB, Livenation, and other
prominent concert and festival events throughout North America. See Events Playbook and Assumptions: Events Offering for more information on assumptions.
4.Please see Financial Information disclaimer on Page 4
5.Rally's Events marketing and business development efforts will focus on fan communities in targeted regions, which is expected to result in greater brand awareness and fill rates year over year.
6.Management expects a correlation between the price of an event ticket and transportation fare. MLB, NBA, NHL, and concerts are expected to be cheaper to attend, resulting in cheaper fare prices.
7.Cost of goods sold per bus is expected to increase each year due to the rising costs of operating a bus, such as gas costs, labor, and maintenance.
56
rallyView entire presentation