Lyft Results Presentation Deck
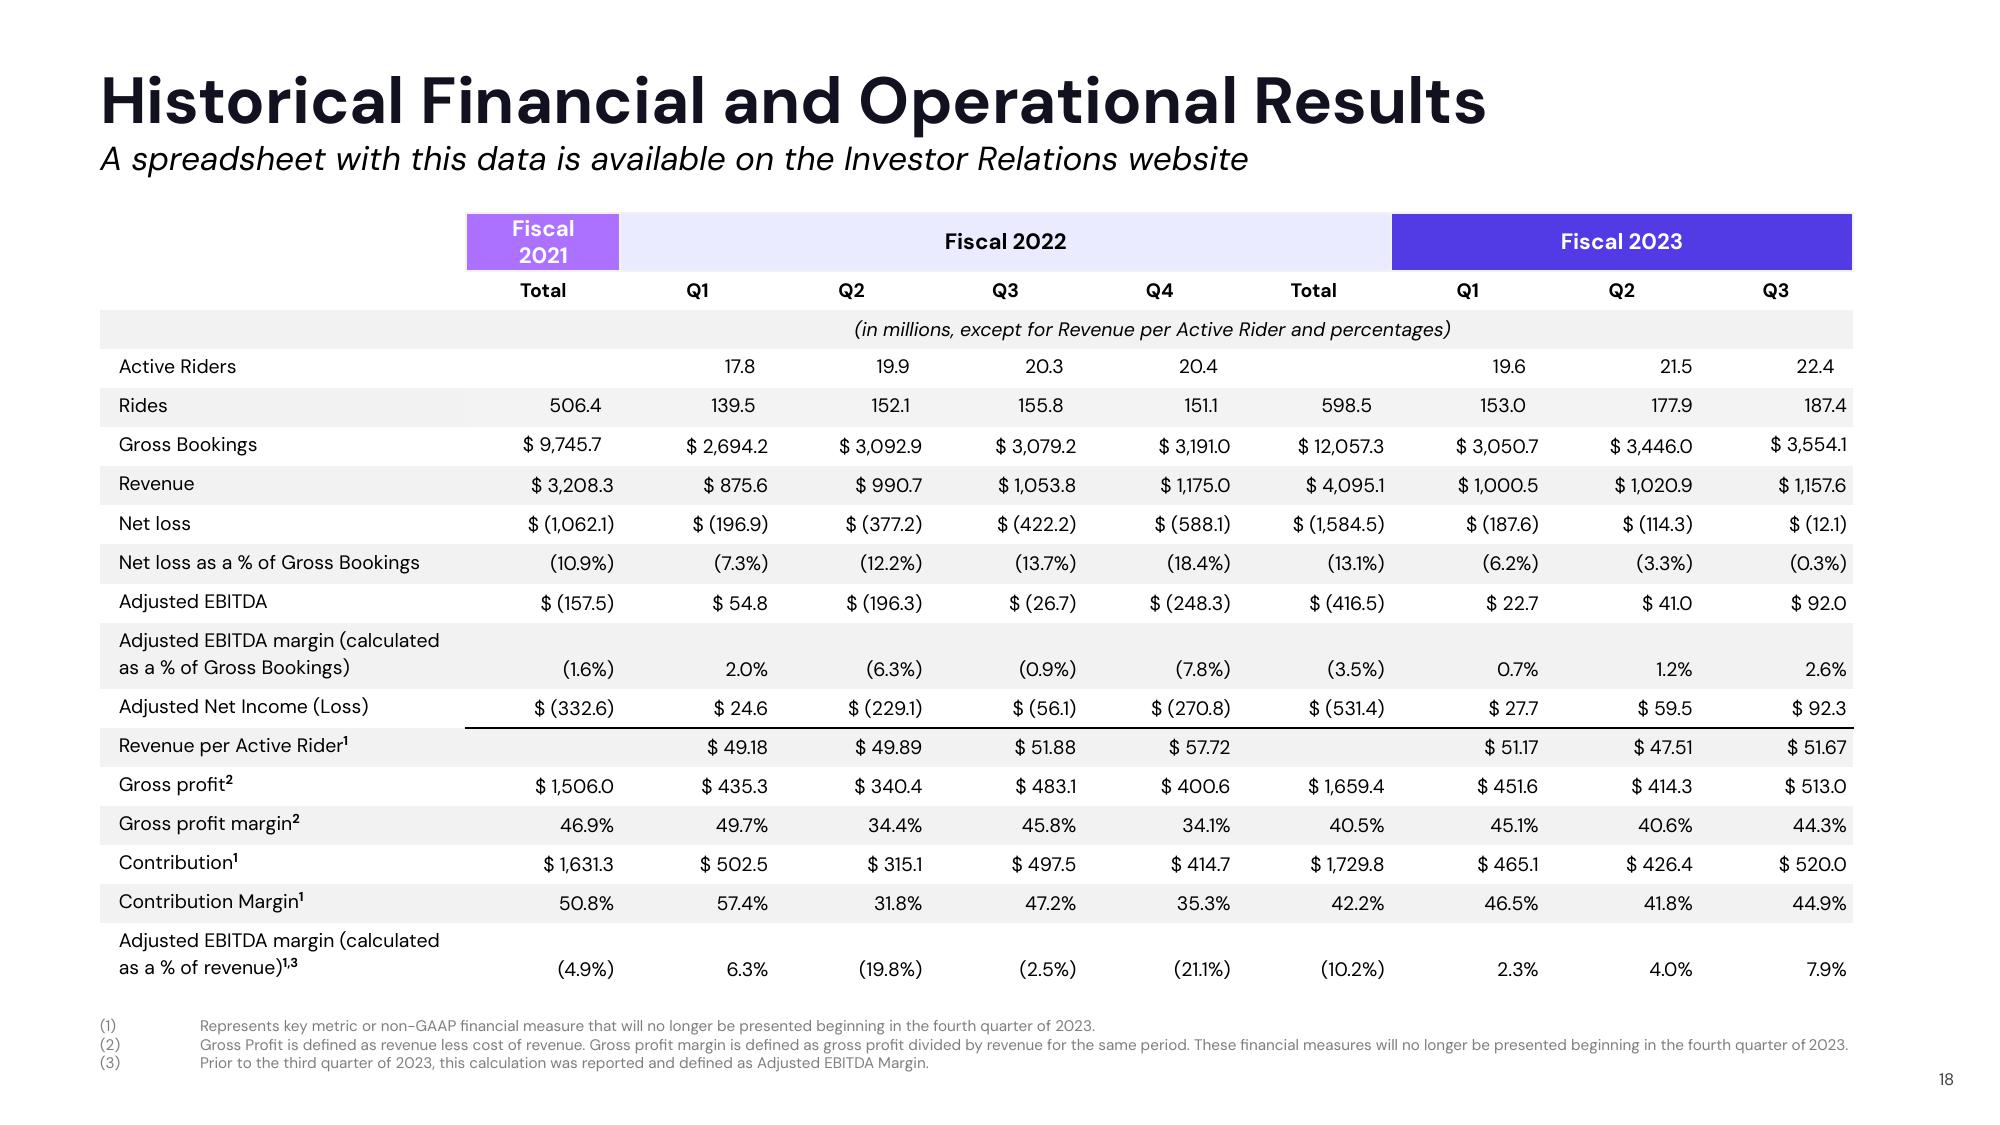
Historical Financial and Operational Results
A spreadsheet with this data is available on the Investor Relations website
Active Riders
Rides
Gross Bookings
Revenue
Net loss
Net loss as a % of Gross Bookings
Adjusted EBITDA
Adjusted EBITDA margin (calculated
as a % of Gross Bookings)
Adjusted Net Income (Loss)
Revenue per Active Rider¹
Gross profit²
Gross profit margin²
Contribution¹
Contribution Margin¹
Adjusted EBITDA margin (calculated
as a % of revenue)1,3
(1)
(2)
(3)
Fiscal
2021
Total
506.4
$9,745.7
$3,208.3
$ (1,062.1)
(10.9%)
$ (157.5)
(1.6%)
$ (332.6)
$1,506.0
46.9%
$1,631.3
50.8%
(4.9%)
Q1
17.8
139.5
$ 2,694.2
$ 875.6
$ (196.9)
(7.3%)
$54.8
2.0%
$24.6
$ 49.18
$435.3
49.7%
$ 502.5
57.4%
6.3%
Q2
Q3
Q4
Total
(in millions, except for Revenue per Active Rider and percentages)
20.4
151.1
20.3
155.8
$ 3,079.2
$1,053.8
$ (422.2)
(13.7%)
$ (26.7)
$ 3,191.0
$ 1,175.0
$ (588.1)
(18.4%)
$ (248.3)
19.9
152.1
$3,092.9
$990.7
$ (377.2)
(12.2%)
$ (196.3)
(6.3%)
$ (229.1)
$ 49.89
$340.4
34.4%
$ 315.1
31.8%
Fiscal 2022
(19.8%)
(0.9%)
$ (56.1)
$51.88
$ 483.1
45.8%
$497.5
47.2%
(2.5%)
(7.8%)
$ (270.8)
$57.72
$ 400.6
34.1%
$ 414.7
35.3%
(21.1%)
598.5
$ 12,057.3
$ 4,095.1
$ (1,584.5)
(13.1%)
$ (416.5)
(3.5%)
$ (531.4)
$1,659.4
40.5%
$1,729.8
42.2%
(10.2%)
Q1
19.6
153.0
$3,050.7
$1,000.5
$ (187.6)
(6.2%)
$22.7
0.7%
$27.7
$ 51.17
$ 451.6
45.1%
$ 465.1
46.5%
2.3%
Fiscal 2023
Q2
21.5
177.9
$ 3,446.0
$ 1,020.9
$ (114.3)
(3.3%)
$41.0
1.2%
$59.5
$ 47.51
$414.3
40.6%
$426.4
41.8%
4.0%
Q3
22.4
187.4
$ 3,554.1
$ 1,157.6
$ (12.1)
(0.3%)
$92.0
2.6%
$ 92.3
$51.67
$513.0
44.3%
$ 520.0
44.9%
7.9%
Represents key metric or non-GAAP financial measure that will no longer be presented beginning in the fourth quarter of 2023.
Gross Profit is defined as revenue less cost of revenue. Gross profit margin is defined as gross profit divided by revenue for the same period. These financial measures will no longer be presented beginning in the fourth quarter of 2023.
Prior to the third quarter of 2023, this calculation was reported and defined as Adjusted EBITDA Margin.
18View entire presentation