Kymera Investor Presentation Deck
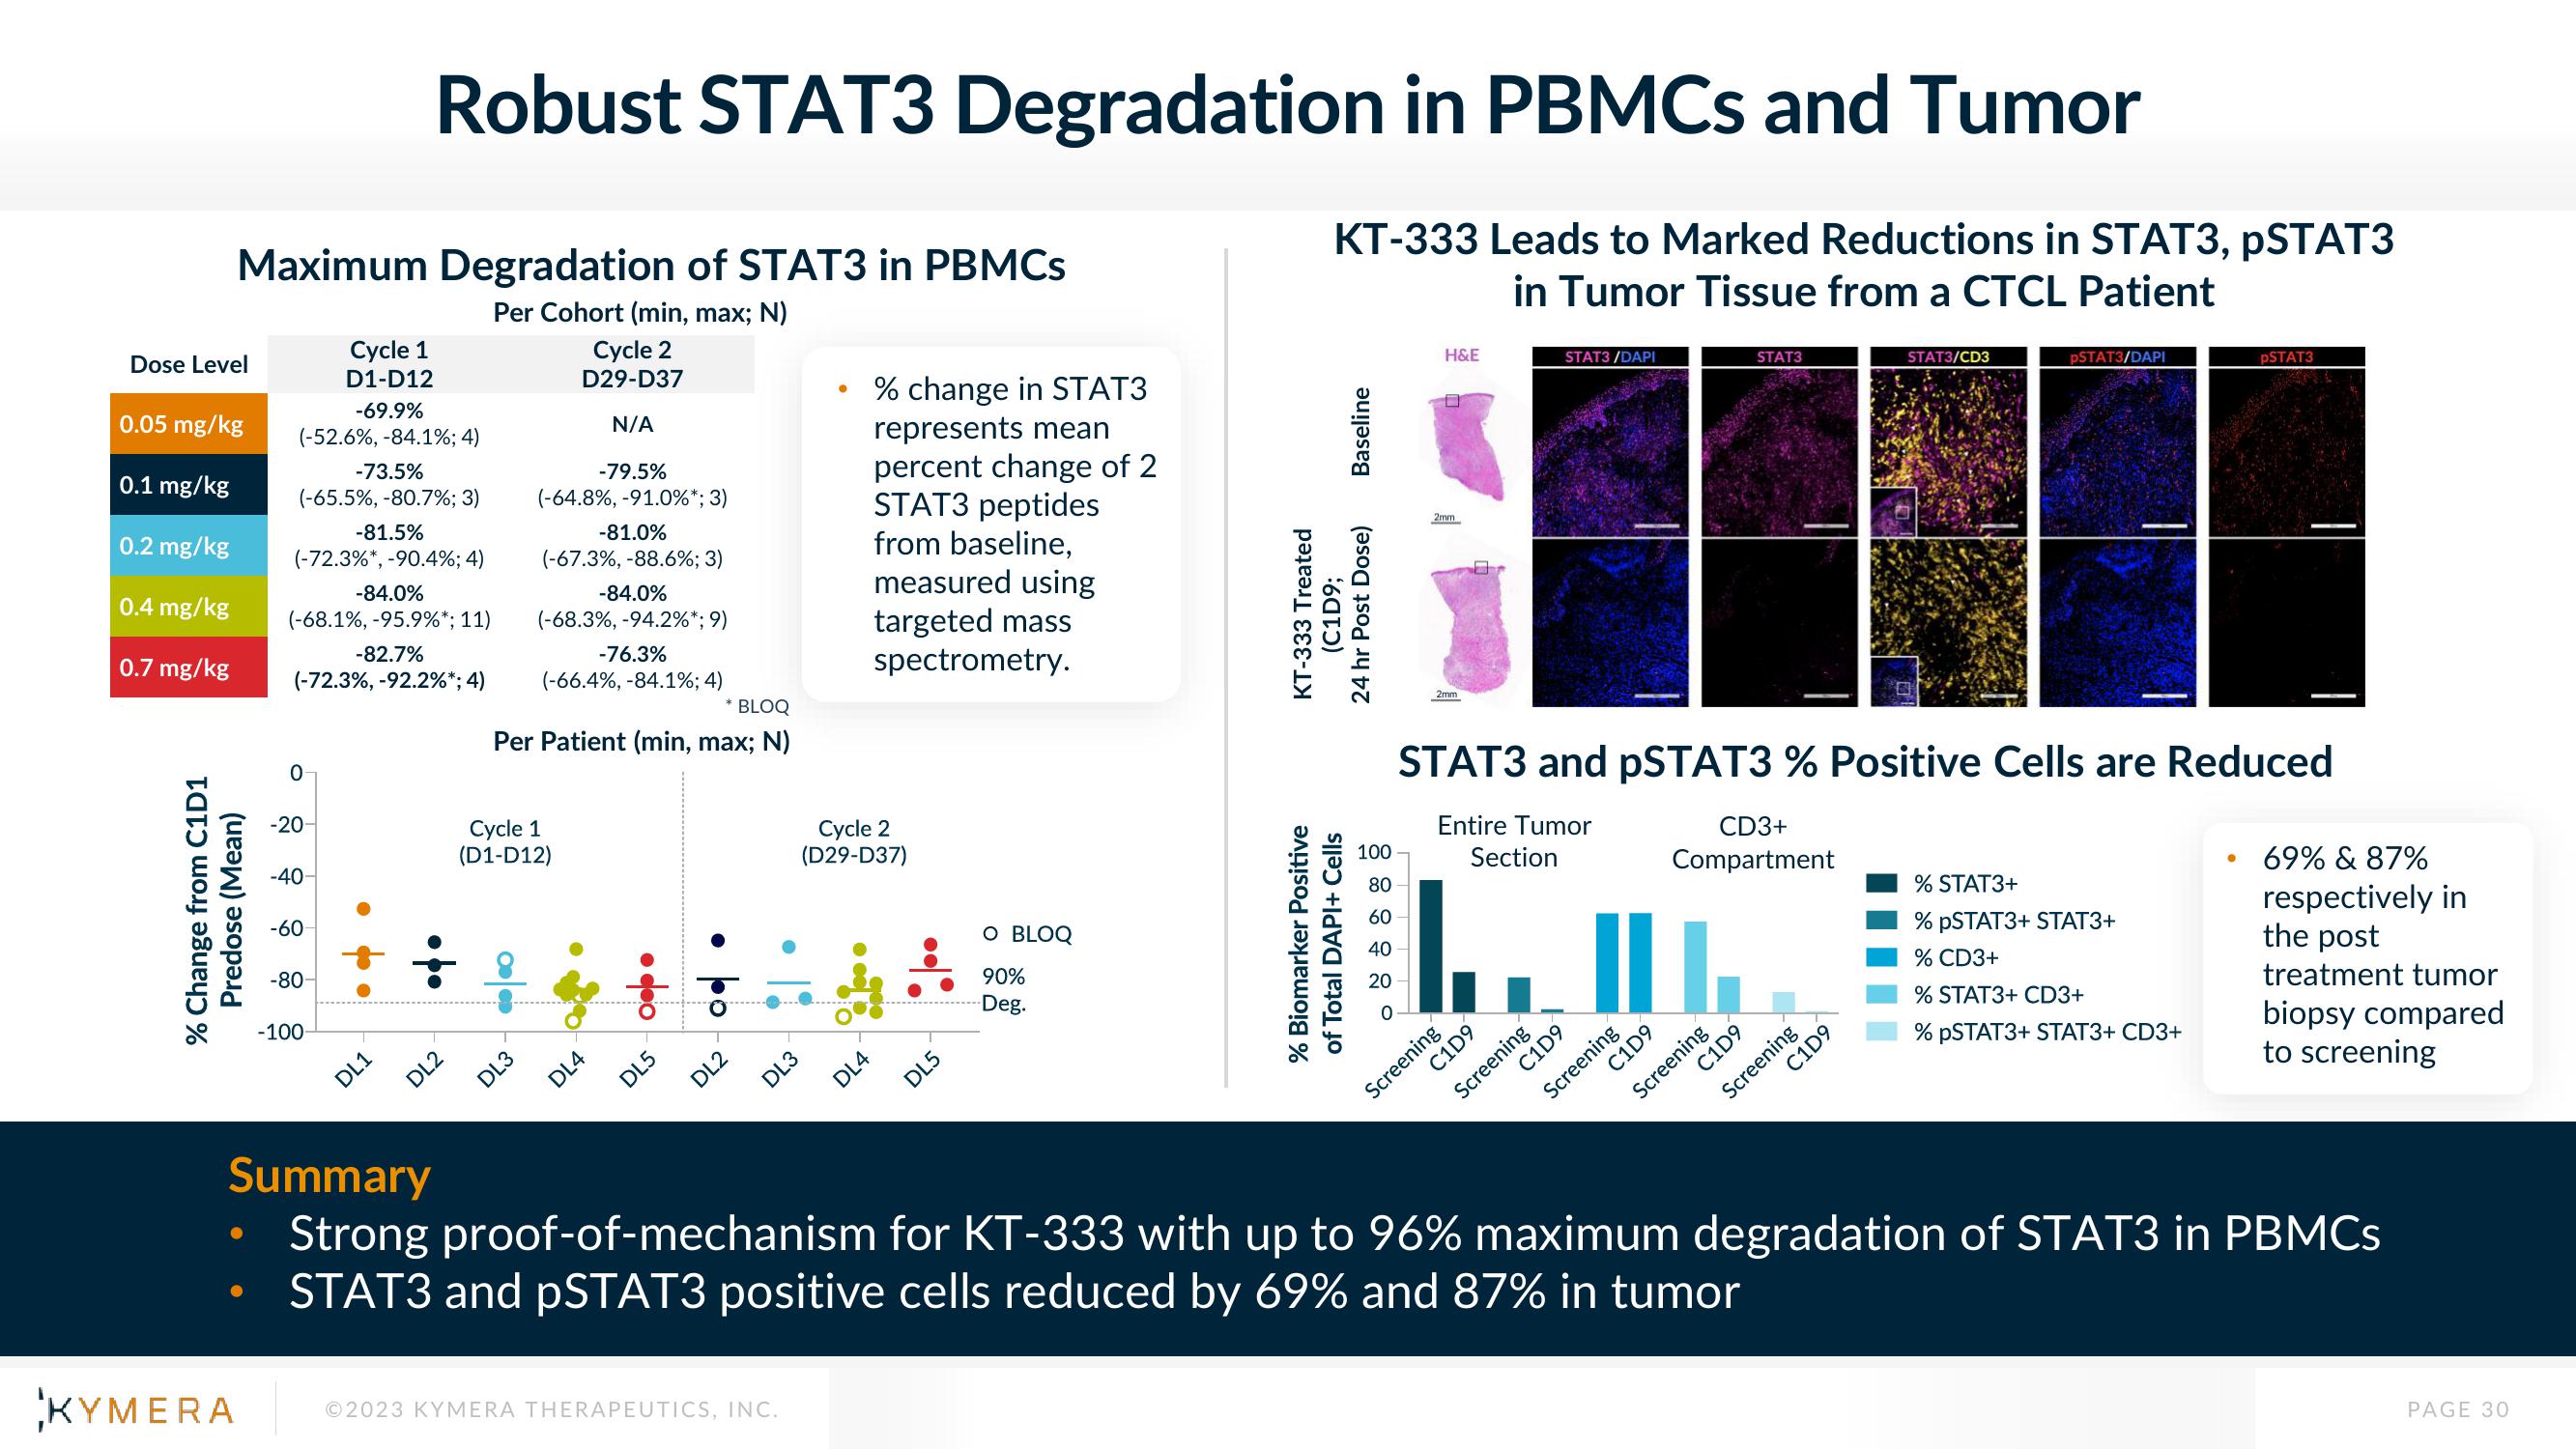
Maximum Degradation of STAT3 in PBMCs
Per Cohort (min, max; N)
Dose Level
0.05 mg/kg
0.1 mg/kg
0.2 mg/kg
0.4 mg/kg
0.7 mg/kg
% Change from C1D1
Predose (Mean)
●
●
Cycle 1
D1-D12
-69.9%
(-52.6%, -84.1%; 4)
-73.5%
(-65.5%, -80.7%; 3)
-81.5%
(-72.3%*, -90.4%; 4)
-84.0%
(-68.1%, -95.9%*; 11)
-82.7%
(-72.3%, -92.2%*; 4)
0
-20
-40-
-60
Robust STAT3 Degradation in PBMCs and Tumor
-80-
-100
DL1
DL2
Cycle 2
D29-D37
N/A
-79.5%
(-64.8%, -91.0%*; 3)
-81.0%
(-67.3%, -88.6%; 3)
-84.0%
(-68.3%, -94.2%*; 9)
-76.3%
(-66.4%, -84.1%; 4)
* BLOQ
Per Patient (min, max; N)
Cycle 1
(D1-D12)
DL3
DL4
3
ㅎㅎ
DL5
DL2
KYMERA Ⓒ2023 KYMERA THERAPEUTICS, INC.
●
DL3
% change in STAT3
represents mean
percent change of 2
STAT3 peptides
from baseline,
measured using
targeted mass
spectrometry.
Cycle 2
(D29-D37)
DL4
DL5
O BLOQ
90%
Deg.
KT-333 Leads to Marked Reductions in STAT3, pSTAT3
in Tumor Tissue from a CTCL Patient
Baseline
KT-333 Treated
(C1D9;
24 hr Post Dose)
% Biomarker Positive
of Total DAPI+ Cells
100
80
60
40
20
0
H&E
2mm
2mm
ning D9
Screening
STAT3/DAPI
Screening
STAT3 and pSTAT3 % Positive Cells are Reduced
Entire Tumor
Section
C1D9
Screening
STAT3
C1D9
Screening D9
CD3+
Compartment
CD9
STAT3/CD3
Screening
pSTAT3/DAPI
pSTAT3
% STAT3+
% pSTAT3+ STAT3+
% CD3+
% STAT3+ CD3+
% pSTAT3+ STAT3+ CD3+
Summary
Strong proof-of-mechanism for KT-333 with up to 96% maximum degradation of STAT3 in PBMCs
STAT3 and pSTAT3 positive cells reduced by 69% and 87% in tumor
69% & 87%
respectively in
the post
treatment tumor
biopsy compared
to screening
PAGE 30View entire presentation