Bed Bath & Beyond Results Presentation Deck
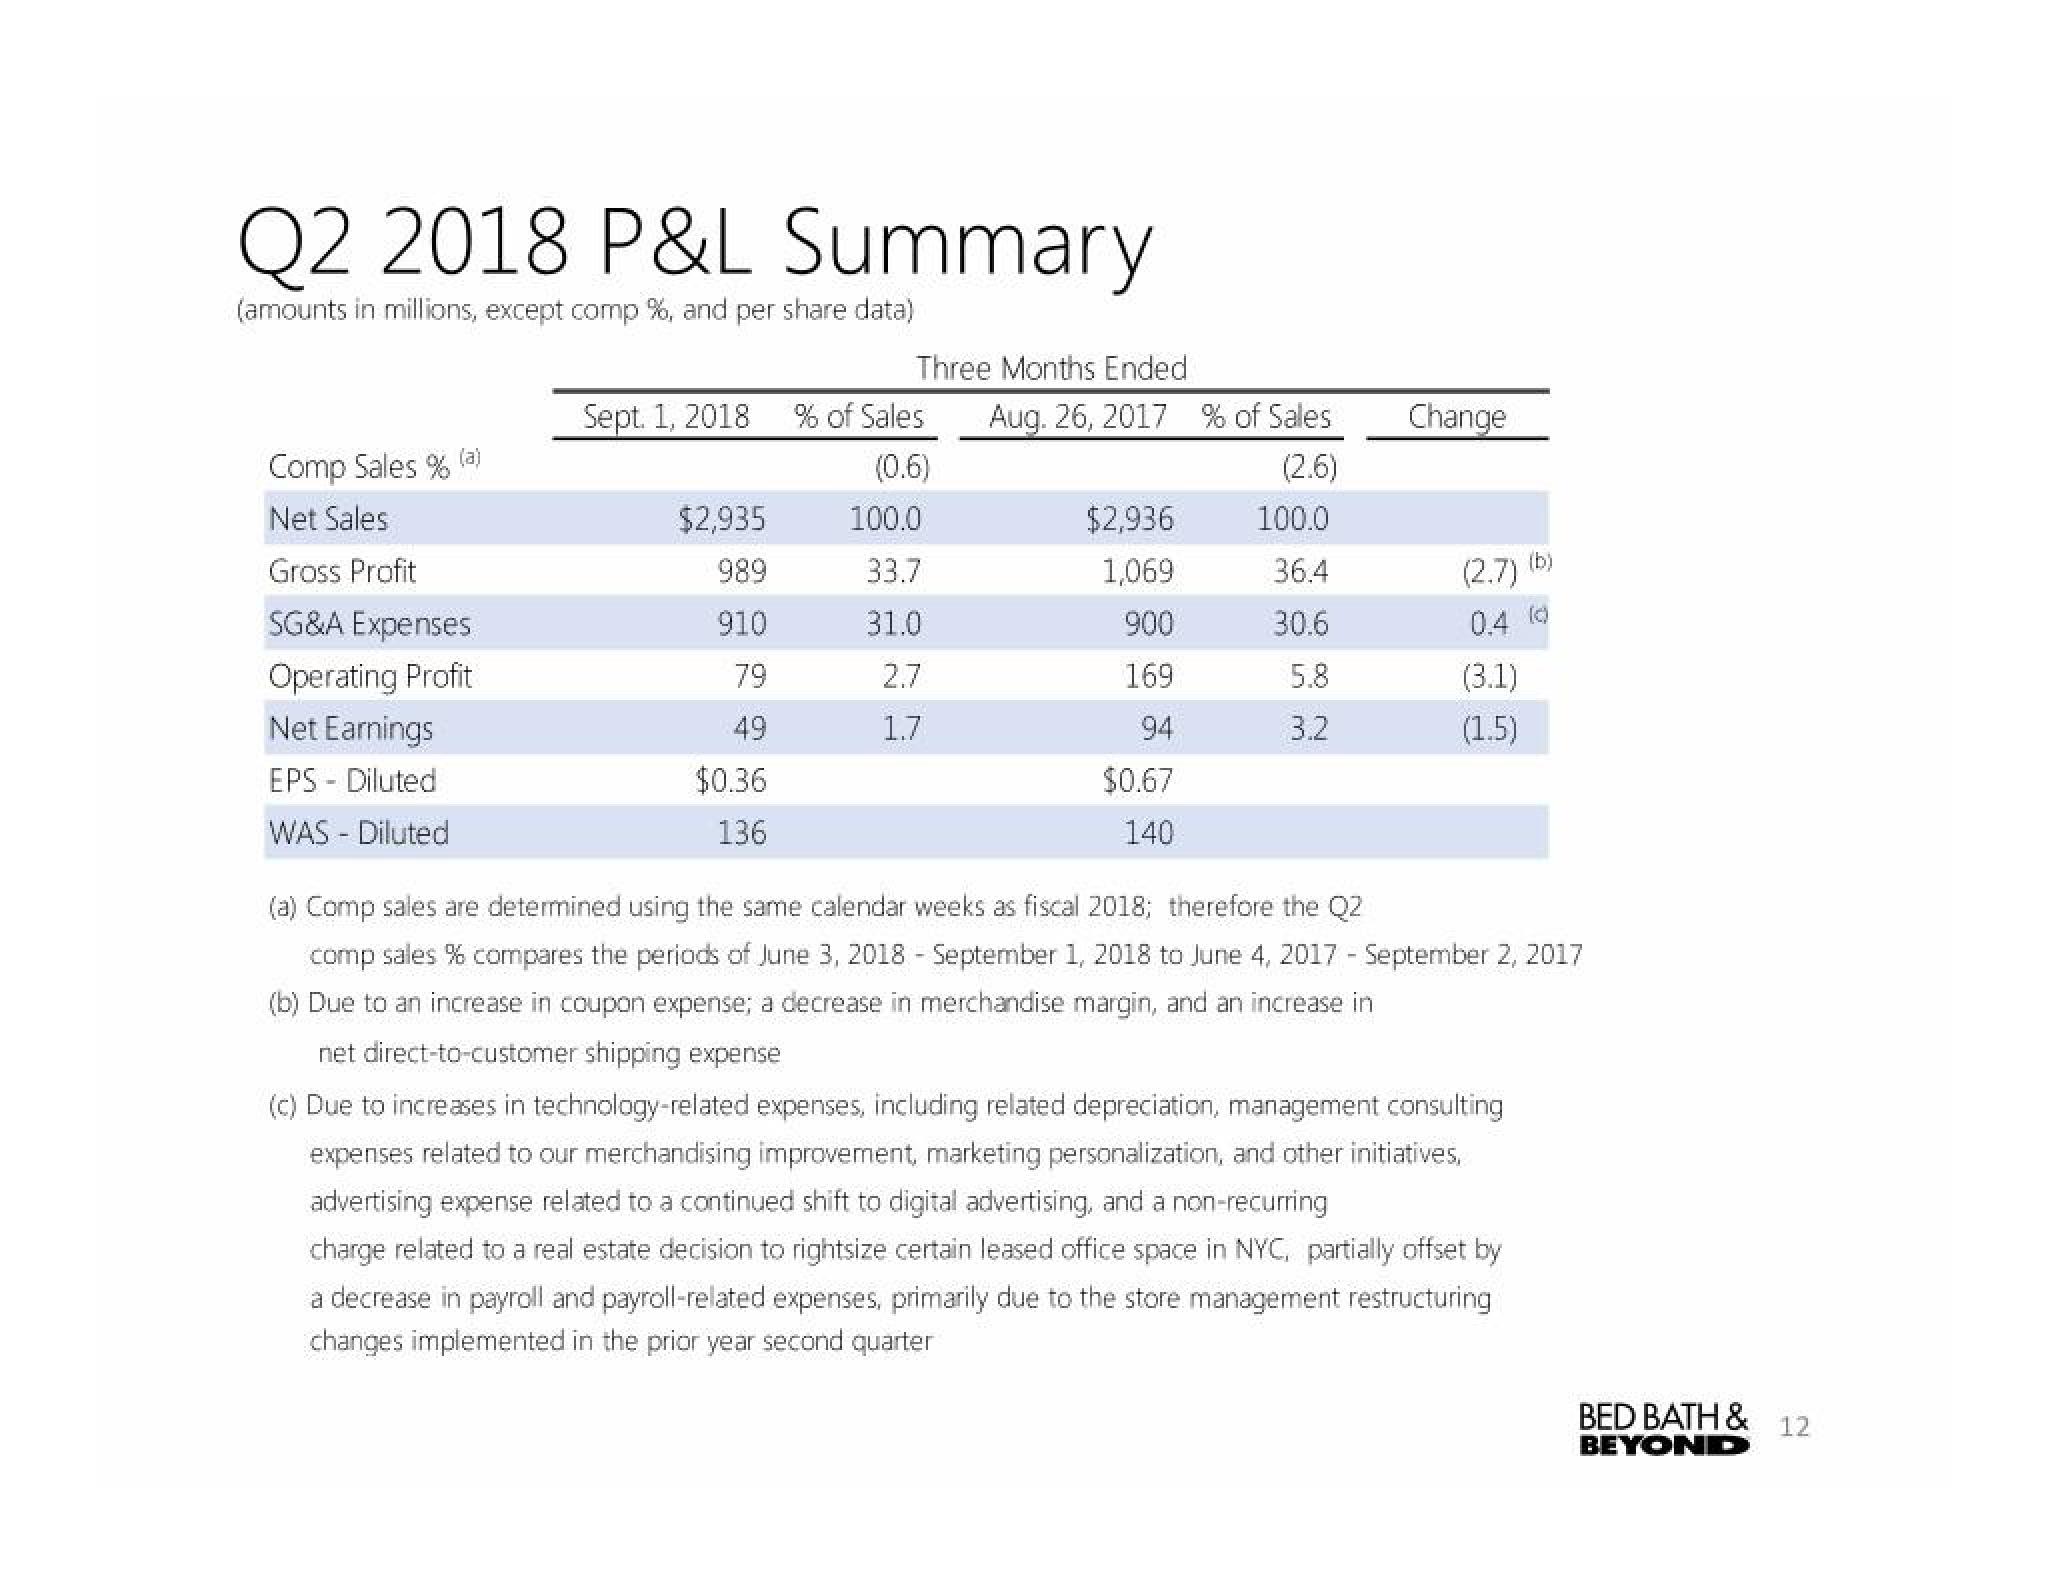
Q2 2018 P&L Summary
(amounts in millions, except comp%, and per share data)
Comp Sales % (a)
Net Sales
Gross Profit
SG&A Expenses
Operating Profit
Net Earnings
EPS - Diluted
WAS - Diluted
Sept. 1, 2018
$2,935
989
910
79
49
$0.36
136
Three Months Ended
% of Sales
(0.6)
100.0
33.7
31.0
2.7
1.7
Aug. 26, 2017 % of Sales
(2.6)
$2,936
1,069
900
169
94
$0.67
140
100.0
36.4
30.6
5.8
3.2
Change
(2.7)
0.4
(3.1)
(1.5)
(b)
(c) Due to increases in technology-related expenses, including related depreciation, management consulting
expenses related to our merchandising improvement, marketing personalization, and other initiatives,
advertising expense related to a continued shift to digital advertising, and a non-recurring
charge related to a real estate decision to rightsize certain leased office space in NYC, partially offset by
a decrease in payroll and payroll-related expenses, primarily due to the store management restructuring
changes implemented in the prior year second quarter
(0)
(a) Comp sales are determined using the same calendar weeks as fiscal 2018; therefore the Q2
comp sales % compares the periods of June 3, 2018 September 1, 2018 to June 4, 2017 - September 2, 2017
(b) Due to an increase in coupon expense; a decrease in merchandise margin, and an increase in
net direct-to-customer shipping expense
BED BATH & 12
BEYONDView entire presentation