Deliveroo Results Presentation Deck
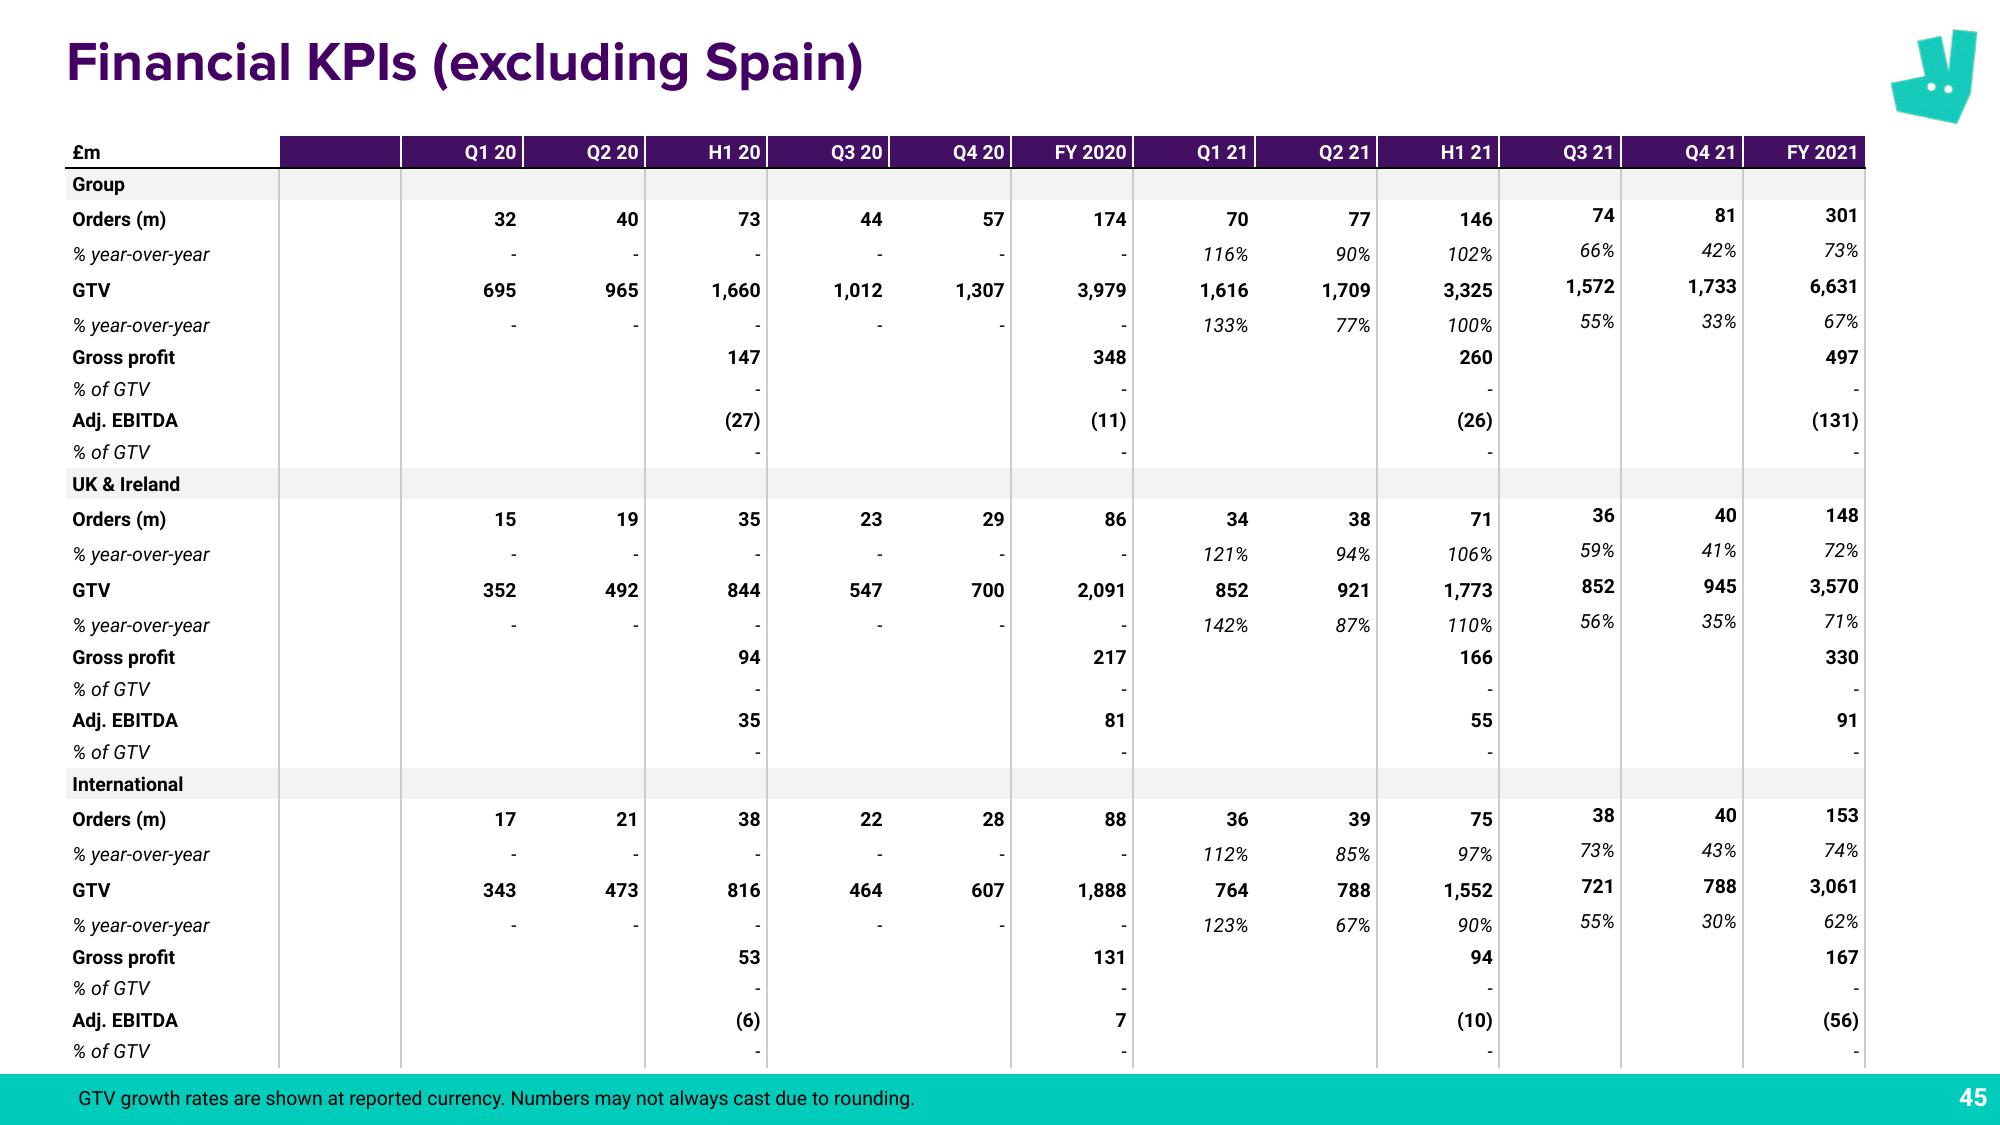
Financial KPIs (excluding Spain)
£m
Group
Orders (m)
% year-over-year
GTV
% year-over-year
Gross profit
% of GTV
Adj. EBITDA
% of GTV
UK & Ireland
Orders (m)
% year-over-year
GTV
% year-over-year
Gross profit
% of GTV
Adj. EBITDA
% of GTV
International
Orders (m)
% year-over-year
GTV
% year-over-year
Gross profit
% of GTV
Adj. EBITDA
% of GTV
Q1 20
32
695
15
352
17
343
Q2 20
40
965
19
492
21
473
H1 20
73
1,660
147
(27)
35
844
94
35
38
816
53
(6)
Q3 20
44
1,012
23
547
22
464
GTV growth rates are shown at reported currency. Numbers may not always cast due to rounding.
Q4 20
57
1,307
29
700
28
607
FY 2020
174
3,979
348
(11)
86
2,091
217
81
88
1,888
131
7
Q1 21
70
116%
1,616
133%
34
121%
852
142%
36
112%
764
123%
Q2 21
77
90%
1,709
77%
38
94%
921
87%
39
85%
788
67%
H1 21
146
102%
3,325
100%
260
(26)
71
106%
1,773
110%
166
55
75
97%
1,552
90%
94
(10)
Q3 21
74
66%
1,572
55%
36
59%
852
56%
38
73%
721
55%
Q4 21
81
42%
1,733
33%
40
41%
945
35%
40
43%
788
30%
FY 2021
301
73%
6,631
67%
497
(131)
148
72%
3,570
71%
330
91
153
74%
3,061
62%
167
(56)
45View entire presentation