Leadership: Bursey & Team Expertise
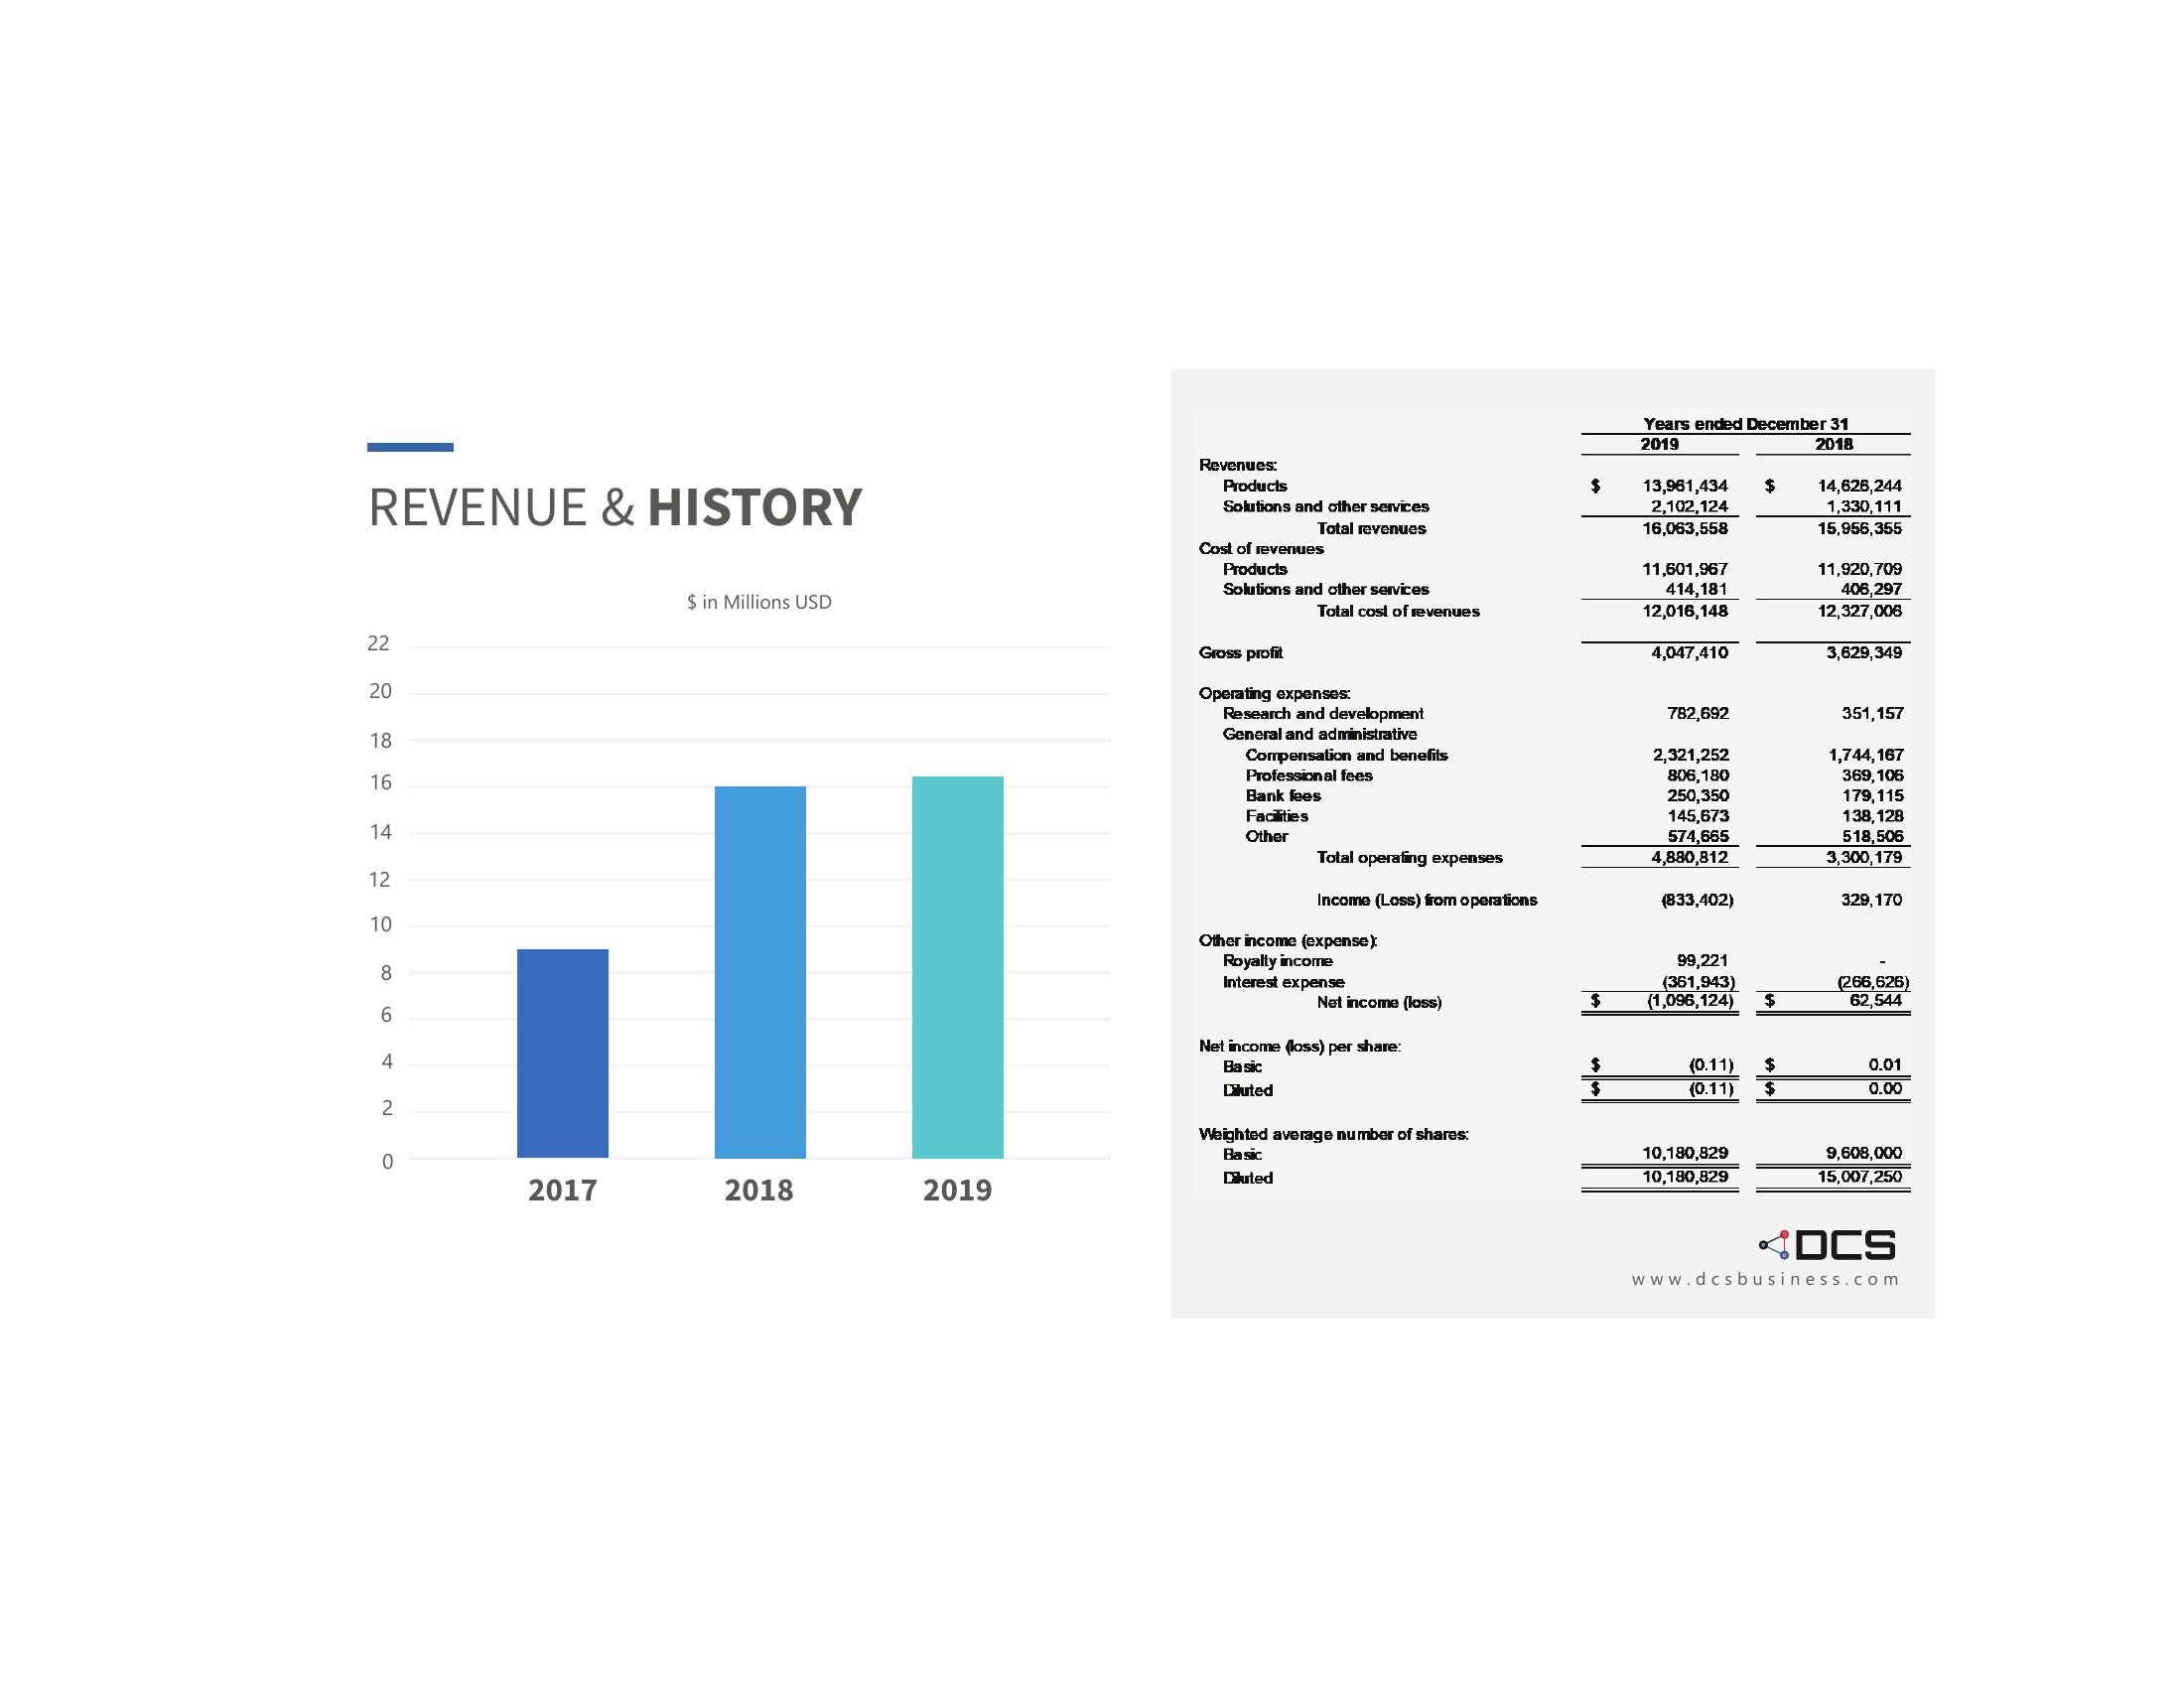
REVENUE & HISTORY
22
20
18
16
14
12
10
8
6
4
2
0
2017
$ in Millions USD
2018
2019
Revenues:
Products
Solutions and other services
Total revenues
Cost of revenues
Products
Solutions and other services
Gross profit
Total cost of revenues
Operating expenses:
Research and development
General and administrative
Compensation and benefits
Professional fees
Bank fees
Facilities
Other
Total operating expenses
Income (Loss) from operations
Other income (expense)
Royalty income
Interest expense
Net income (loss)
Net income (loss) per share:
Basic
Duted
Weighted average number of shares:
Basic
Cuted
$
$
$
$
Years ended December 31
2019
2018
13,961,434
2,102,124
16,063,558
11,601,967
414,181
12,016,148
4,047,410
782,692
2,321,252
806,180
250,350
145,673
574,665
4,880,812
(833,402)
99,221
(361,943)
(1,096,124)
(0.11)
(0.11)
10,180,829
10,180,829
$
$
$
$
14,626,244
1,330,111
15,956,355
11,920,709
406,297
12,327,006
3,629,349
351,157
1,744,167
369,106
179,115
138,128
518,506
3,300,179
329,170
(266,626)
62,544
0.01
0.00
9,608,000
15,007,250
DCS
www.dcsbusiness.comView entire presentation