Snowflake Results Presentation Deck
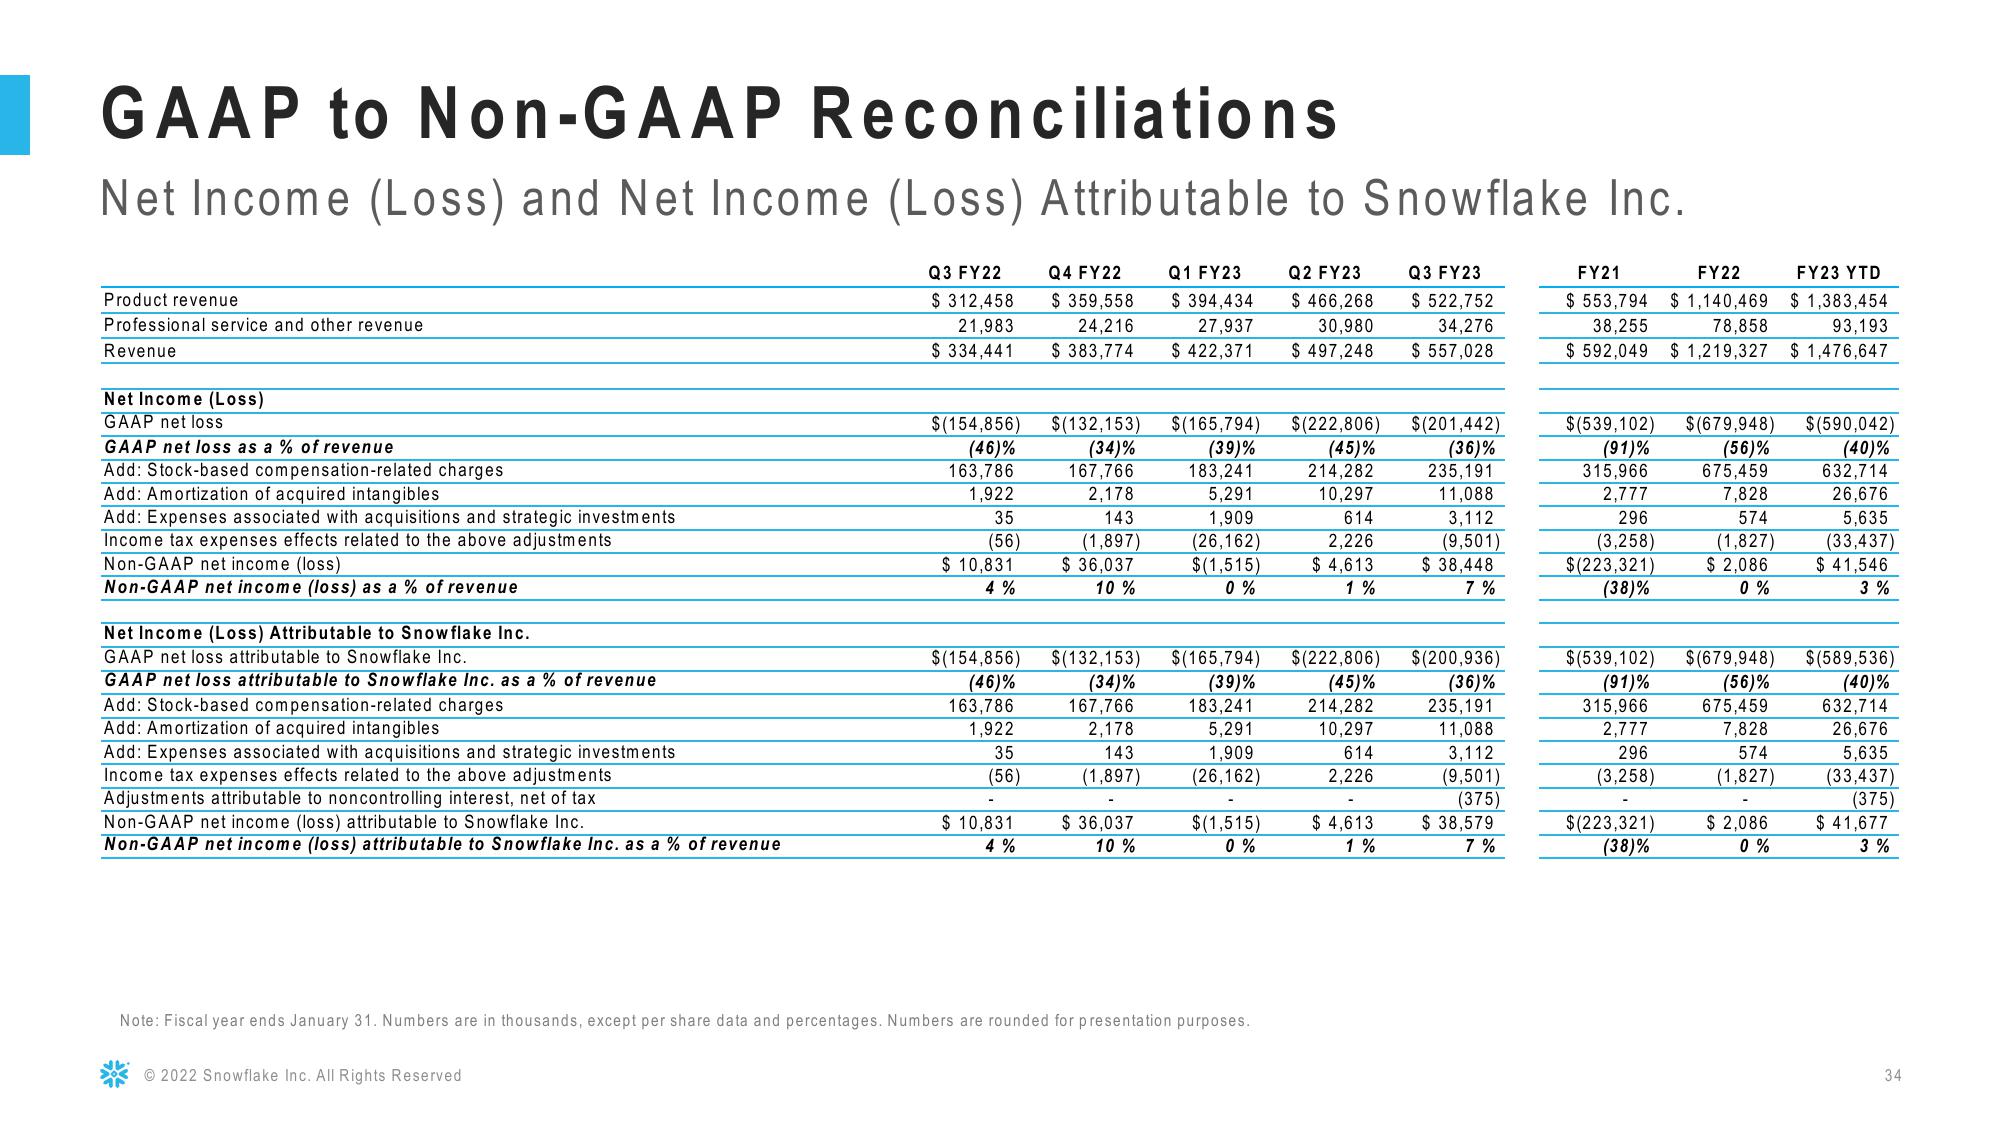
GAAP to Non-GAAP Reconciliations
Net Income (Loss) and Net Income (Loss) Attributable to Snowflake Inc.
Q3 FY22
$ 312,458
21,983
Q1 FY23
$ 394,434
27,937
Q2 FY23
$ 466,268
30,980
$ 497,248
Q3 FY23
$ 522,752
34,276
$ 334,441
$ 422,371
$ 557,028
Product revenue
Professional service and other revenue
Revenue
Net Income (Loss)
GAAP net loss
GAAP net loss as a % of revenue
Add: Stock-based compensation-related charges
Add: Amortization of acquired intangibles
Add: Expenses associated with acquisitions and strategic investments
Income tax expenses effects related to the above adjustments
Non-GAAP net income (loss)
Non-GAAP net income (loss) as a % of revenue
Net Income (Loss) Attributable to Snowflake Inc.
GAAP net loss attributable to Snowflake Inc.
GAAP net loss attributable to Snowflake Inc. as a % of revenue
Add: Stock-based compensation-related charges
Add: Amortization of acquired intangibles
Add: Expenses associated with acquisitions and strategic investments
Income tax expenses effects related to the above adjustments
Adjustments attributable to non controlling interest, net of tax
Non-GAAP net income (loss) attributable to Snowflake Inc.
Non-GAAP net income (loss) attributable to Snowflake Inc. as a % of revenue
Ⓒ2022 Snowflake Inc. All Rights Reserved
Q4 FY22
$ 359,558
24,216
$ 383,774
$(154,856) $(132,153)
(46)%
163,786
1,922
35
(34)%
167,766
2,178
143
(1,897)
$ 36,037
(56)
$ 10,831
4%
10%
$(154,856) $(132,153)
(46)%
163,786
1,922
35
(56)
$ 10,831
4%
(34)%
167,766
2,178
143
(1,897)
$ 36,037
10%
$(165,794)
(39)%
183,241
5,291
1,909
(26,162)
$(1,515)
0%
$(165,794) $(222,806)
(39)%
183,241
5,291
1,909
(26,162)
$(1,515)
0%
Note: Fiscal year ends January 31. Numbers are in thousands, except per share data and percentages. Numbers are rounded for presentation purposes.
$(222,806)
(45)%
214,282
10,297
614
2,226
$4,613
1%
(45)%
214,282
10,297
614
2,226
$ 4,613
1%
$(201,442)
(36)%
235,191
11,088
3,112
(9,501)
$ 38,448
7%
$(200,936)
(36)%
235,191
11,088
3,112
(9,501)
(375)
$ 38,579
7%
FY21
FY22
$ 553,794 $ 1,140,469
38,255
78,858
$592,049 $1,219,327
$(539,102) $(679,948)
(91)%
(56)%
315,966 675,459
2,777
7,828
296
574
(3,258) (1,827)
$(223,321) $ 2,086
(38)%
0%
$(539,102) $(679,948)
(91)%
(56)%
315,966 675,459
2,777
7,828
296
574
(3,258) (1,827)
$(223,321)
(38)%
$ 2,086
0%
FY23 YTD
$ 1,383,454
93,193
$ 1,476,647
$(590,042)
(40)%
632,714
26,676
5,635
(33,437)
$ 41,546
3%
$(589,536)
(40)%
632,714
26,676
5,635
(33,437)
(375)
$ 41,677
3%
34View entire presentation