Taboola Investor Presentation Deck
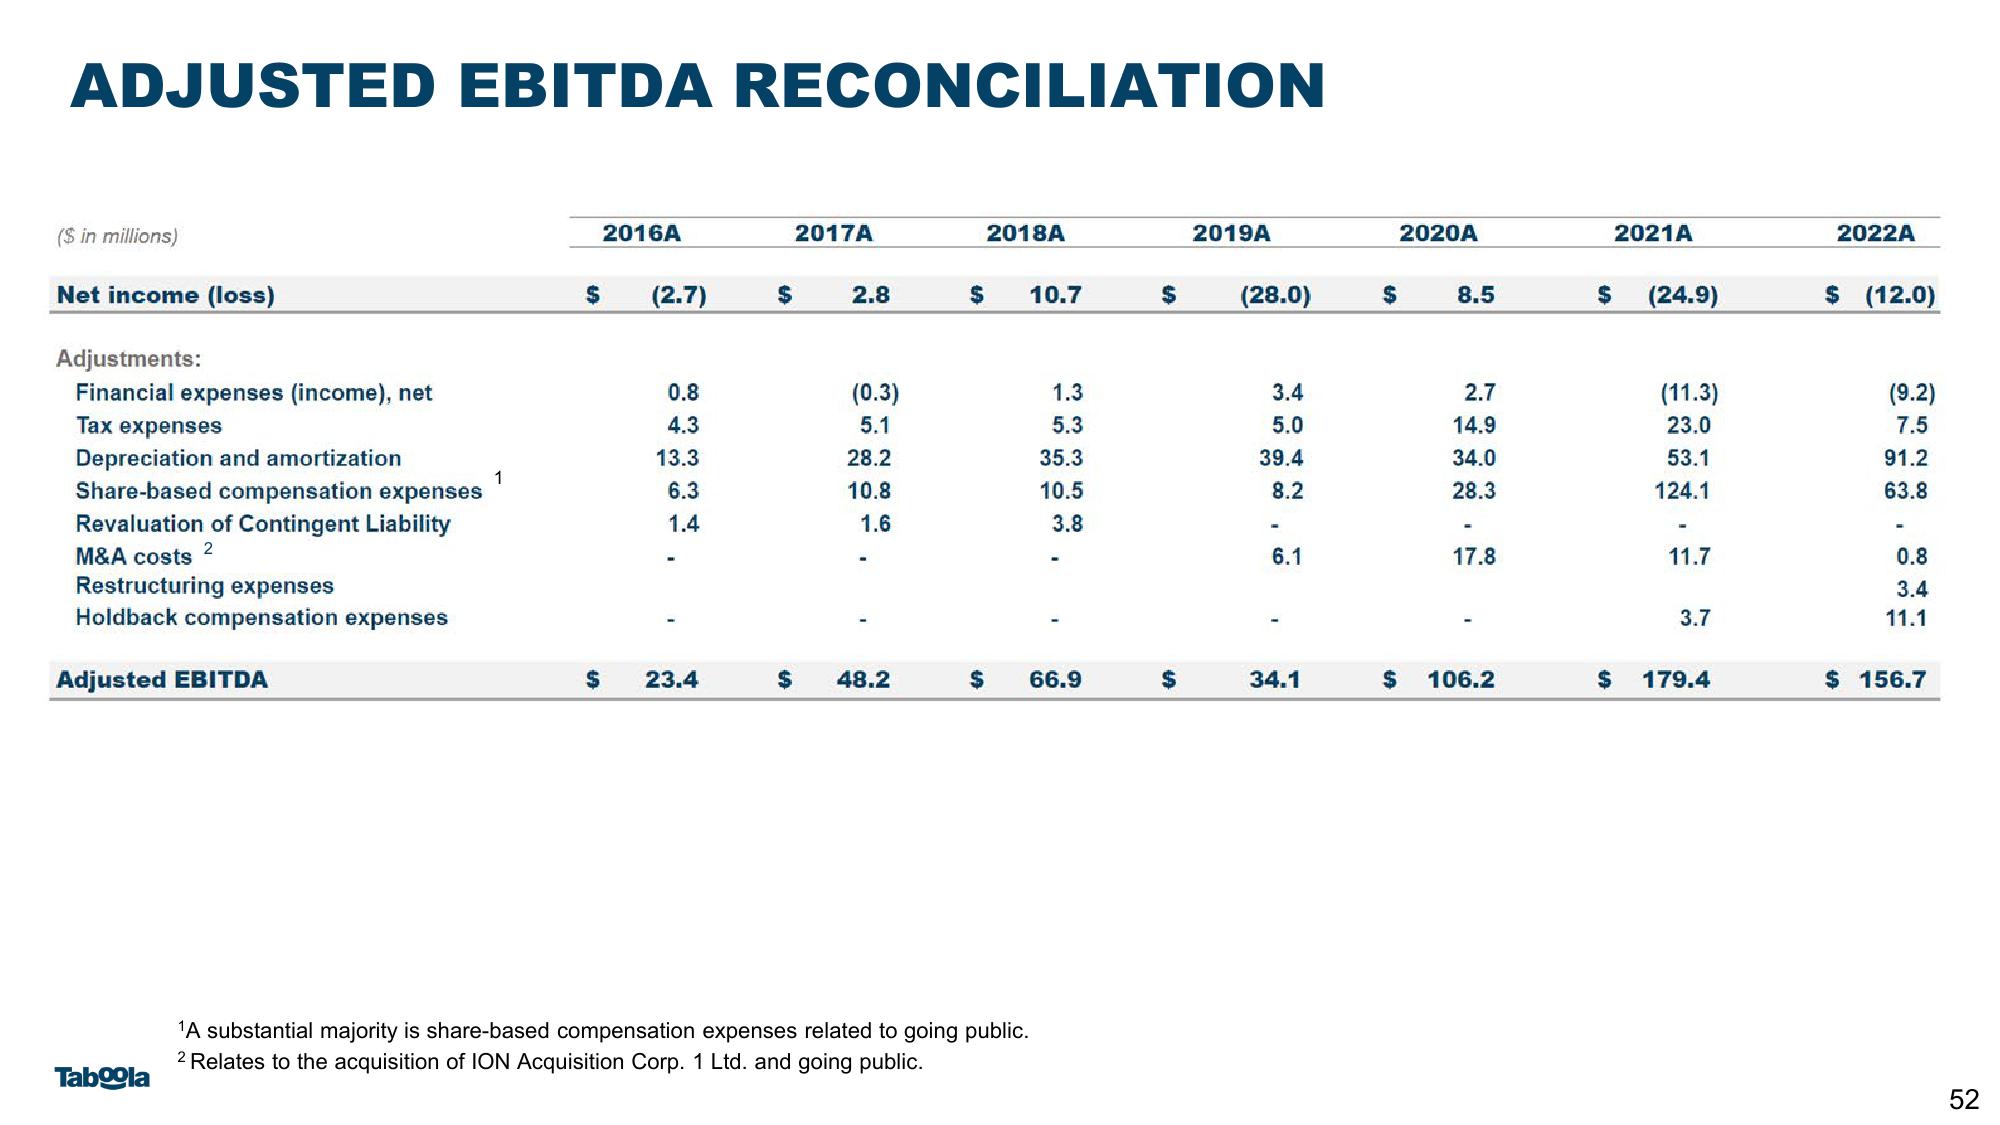
ADJUSTED EBITDA RECONCILIATION
($ in millions)
Net income (loss)
Adjustments:
Financial expenses (income), net
Tax expenses
Depreciation and amortization
Share-based compensation expenses
Revaluation of Contingent Liability
2
M&A costs
Restructuring expenses
Holdback compensation expenses
Adjusted EBITDA
Taboola
1
$
2016A
(2.7)
0.8
4.3
13.3
6.3
1.4
$ 23.4
$
2017A
2.8
(0.3)
5.1
28.2
10.8
1.6
48.2
2018A
$
S
10.7
1.3
5.3
35.3
10.5
3.8
66.9
¹A substantial majority is share-based compensation expenses related to going public.
2 Relates to the acquisition of ION Acquisition Corp. 1 Ltd. and going public.
2019A
$ (28.0)
$
3.4
5.0
39.4
8.2
6.1
34.1
$
$
2020A
8.5
2.7
14.9
34.0
28.3
17.8
106.2
$
2021A
(24.9)
(11.3)
23.0
53.1
124.1
-
11.7
3.7
$ 179.4
2022A
$ (12.0)
(9.2)
7.5
91.2
63.8
-
0.8
3.4
11.1
$ 156.7
52View entire presentation