Lazard Investor Presentation Deck
INVESTOR PRESENTATION
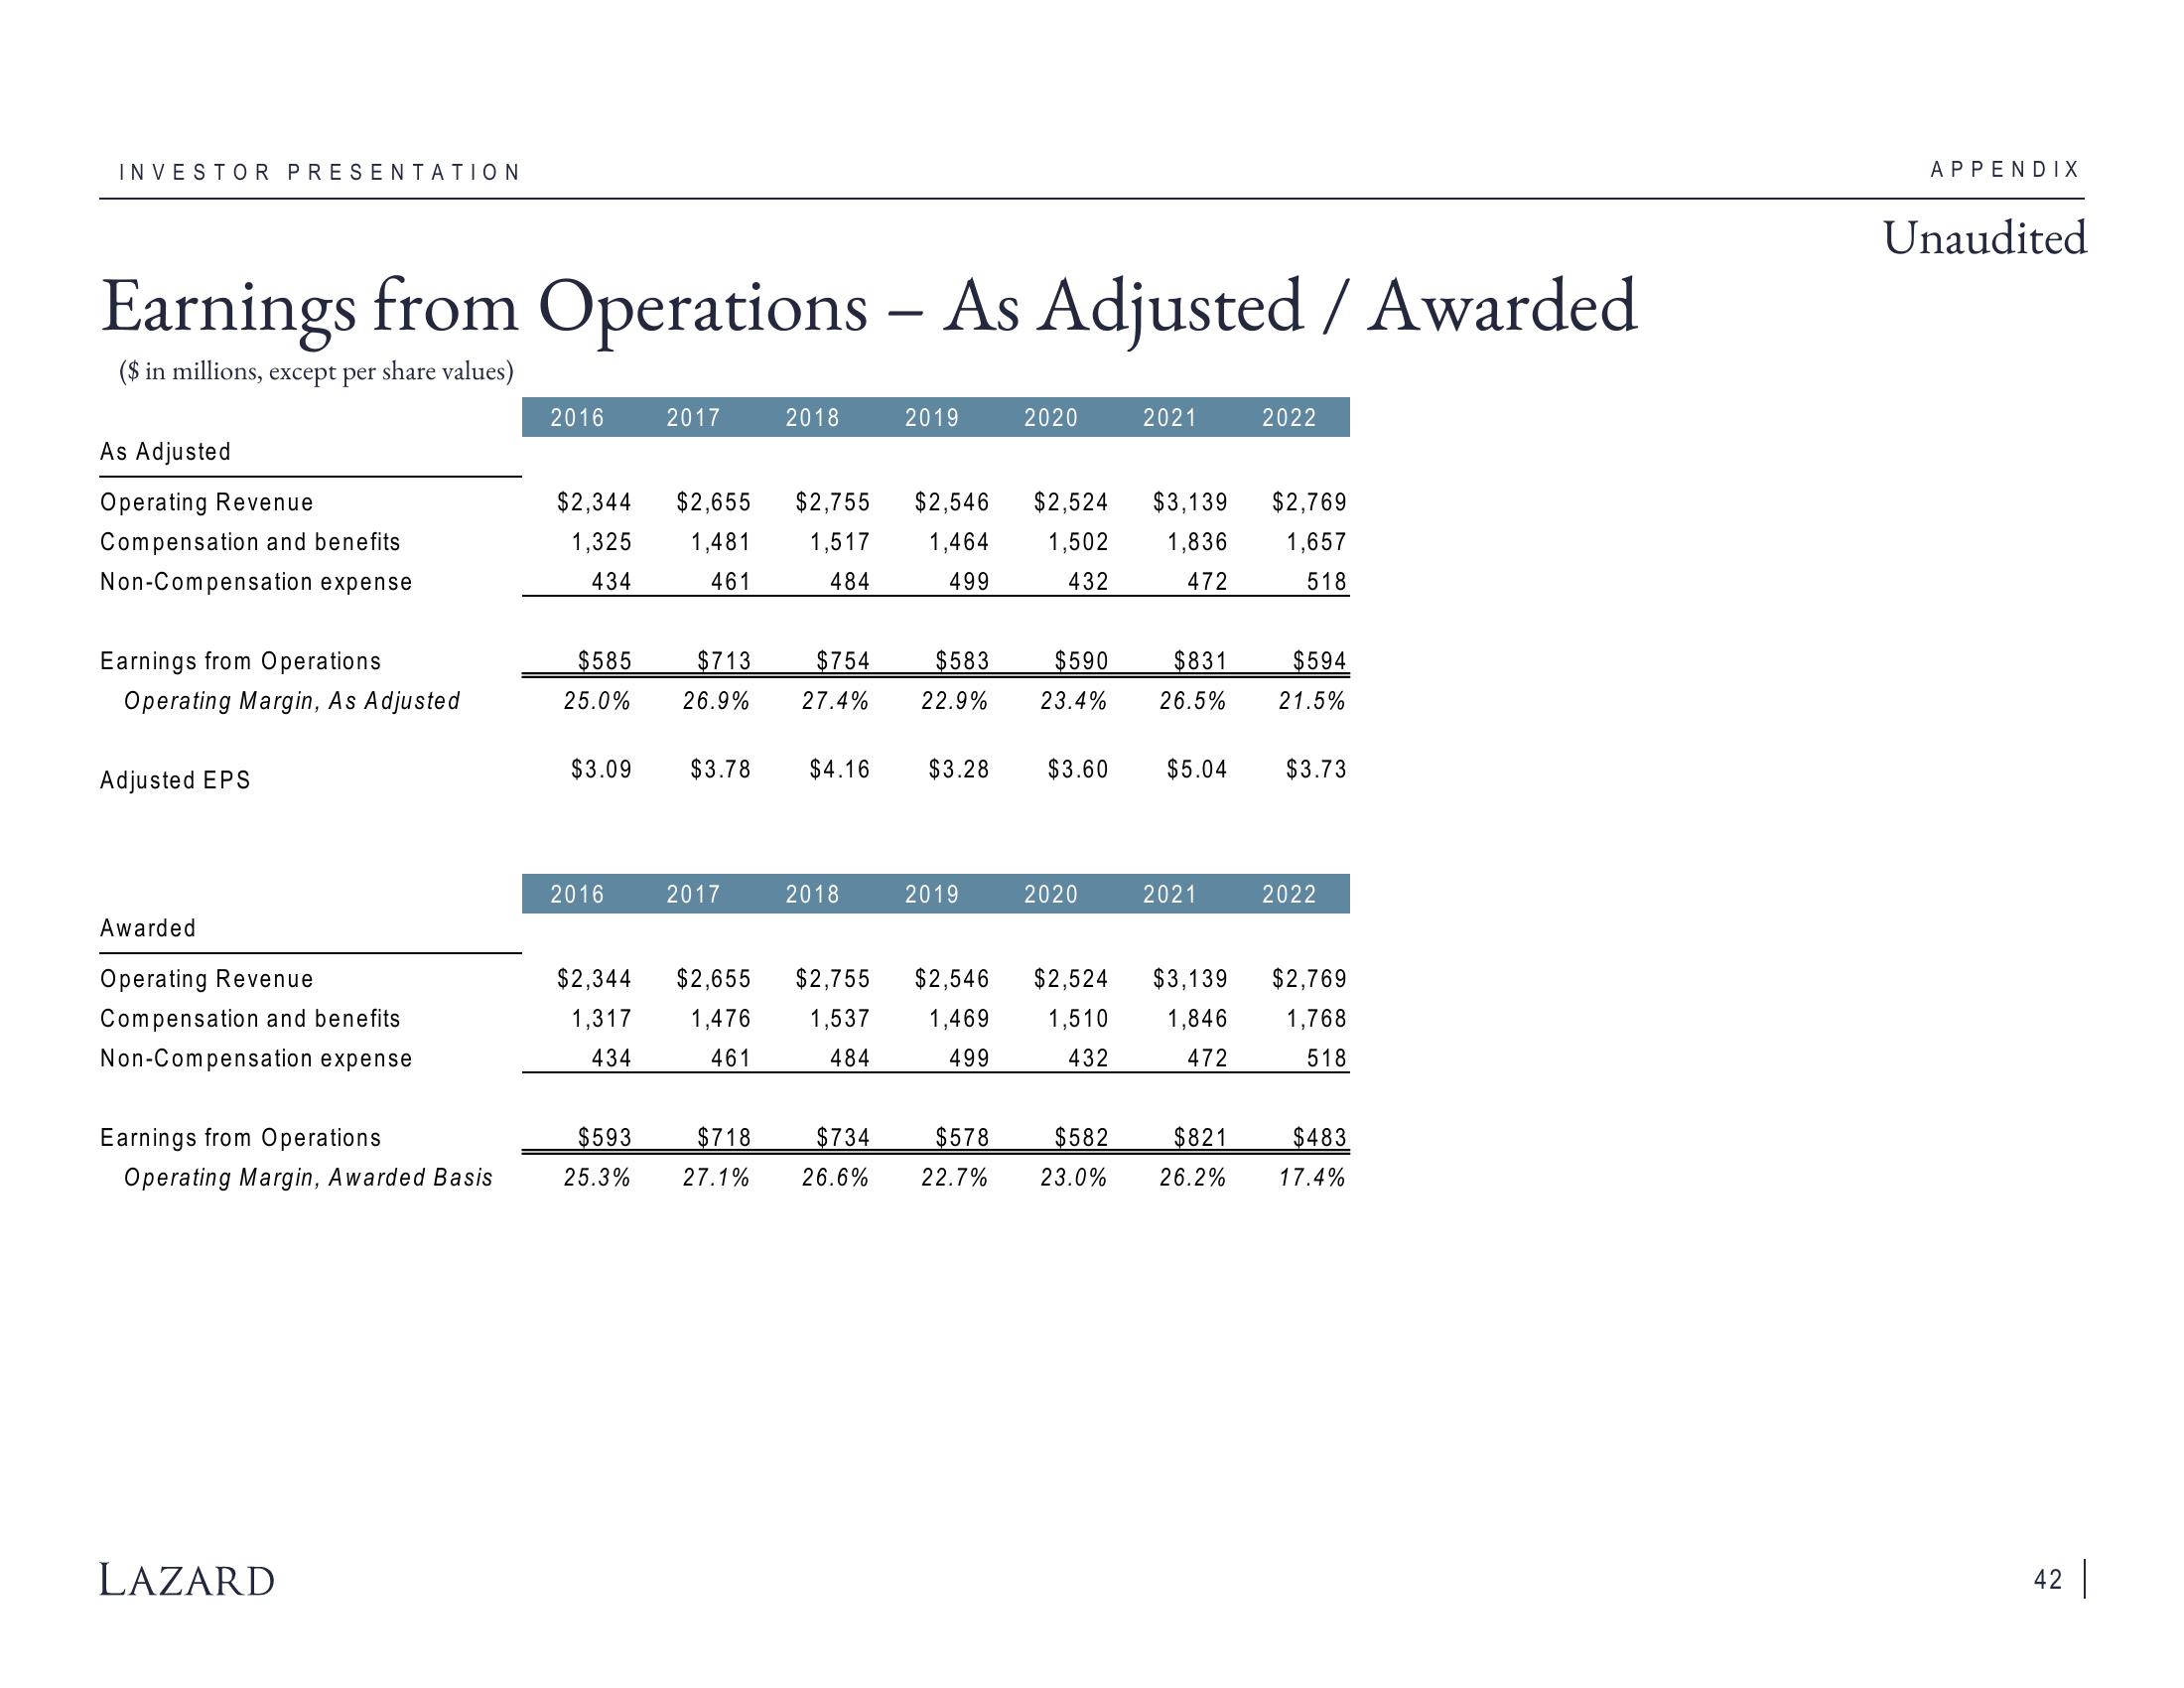
Earnings from Operations - As Adjusted / Awarded
($ in millions, except per share values)
As Adjusted
Operating Revenue
Compensation and benefits
Non-Compensation expense
Earnings from Operations
Operating Margin, As Adjusted
Adjusted EPS
Awarded
Operating Revenue
Compensation and benefits
Non-Compensation expense
Earnings from Operations
Operating Margin, Awarded Basis
LAZARD
2016
$585
25.0%
$2,344 $2,655 $2,755
1,325
1,481
1,517
434
461
484
$3.09
2016
2017
$593
25.3%
2018
2017
2019
$3.78 $4.16 $3.28
2018
$583
$590
$831
$594
$713 $754
26.9% 27.4% 22.9% 23.4% 26.5% 21.5%
$734
$718
27.1% 26.6%
$2,344 $2,655 $2,755 $2,546
1,317 1,476 1,537
434
484
461
2020
$2,546 $2,524 $3,139 $2,769
1,464
1,502
1,836
1,657
499
432
472
518
2019
$3.60
2021
2020
$5.04
$578
22.7% 23.0%
2021
2022
1,469 1,510 1,846
499
432
472
$2,524 $3,139 $2,769
1,768
518
$582 $821
$3.73
2022
$483
26.2% 17.4%
APPENDIX
Unaudited
42 |View entire presentation