Sonos Results Presentation Deck
Investing in the Business in Q4
R&D (GAAP)
Less: Stock-based compensation
R&D (Non-GAAP)
% of revenue
S&M (GAAP)
Less: Restructuring and related charges
Less: Stock-based compensation
S&M (Non-GAAP)
% of revenue
G&A (GAAP)
Less: Stock-based compensation
Less: Legal and transaction related costs
Adjusted G&A (Non-GAAP)
% of revenue
Total Operating Expenses (GAAP)
% of revenue
Less: Restructuring and related charges
Less: Stock-based compensation
Less: Legal and transaction related costs
Adjusted Operating Expenses (Non-GAAP)
% of revenue
Q4'22
67.3
8.0
59.2
18.7%
72.6
3.7
69.0
21.8%
44.2
6.0
5.5
32.7
10.3%
184.2
58.2%
17.7
5.5
160.9
50.9%
Q4'21
65.8
6.0
59.8
16.6%
73.2
0.2
3.3
69.8
19.4%
39.5
5.8
5.0
28.6
7.9%
178.5
49.6%
0.2
15.1
5.0
158.2
44.0%
Y/Y Change
2%
34%
(1)%
210bps
(1)%
na
13%
(1)%
240bps
12%
2%
10%
15%
240bps
3%
860bps
na
17%
10%
2%
690bps
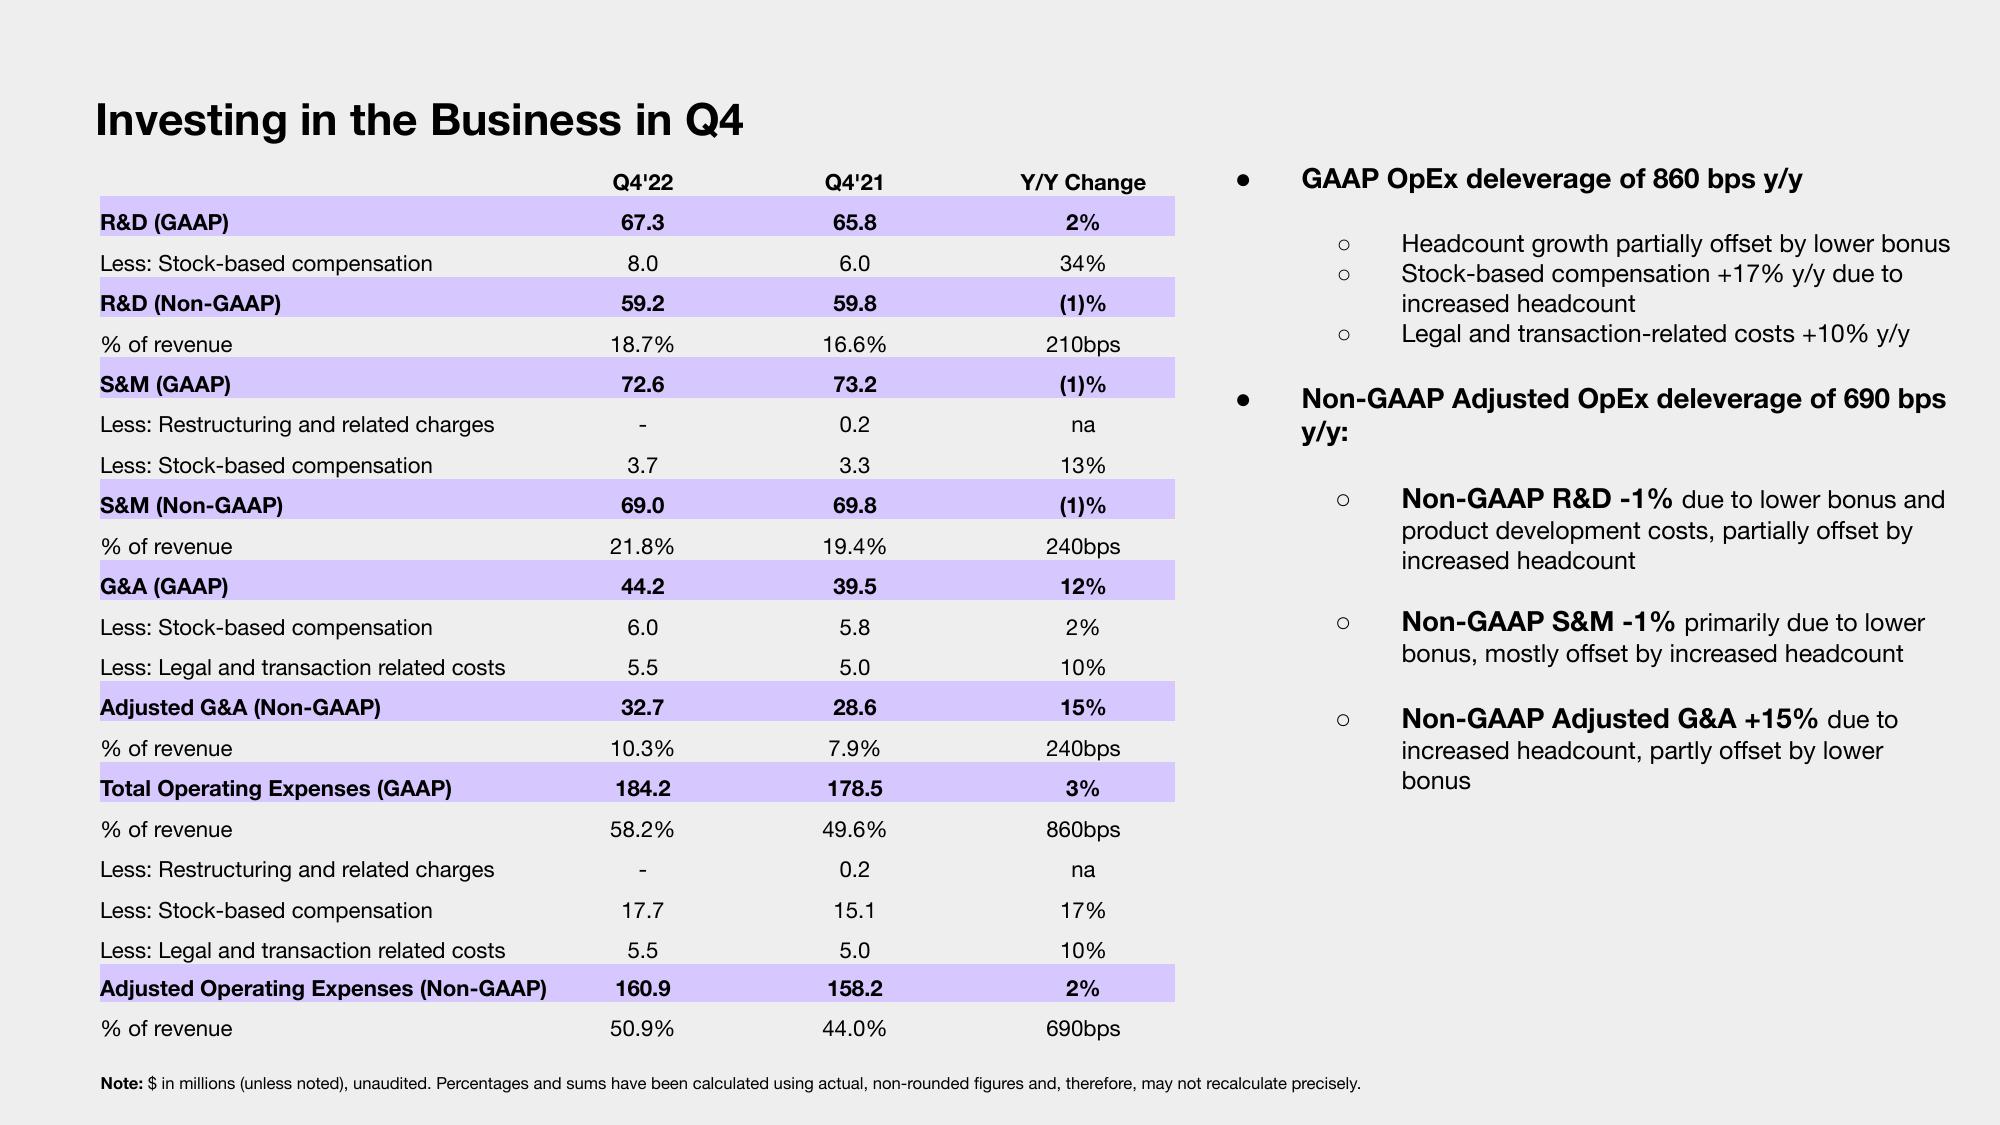
GAAP OpEx deleverage of 860 bps y/y
O
O
O
Non-GAAP Adjusted OpEx deleverage of 690 bps
y/y:
O
Headcount growth partially offset by lower bonus
Stock-based compensation +17% y/y due to
increased headcount
Legal and transaction-related costs +10% y/y
O
O Non-GAAP S&M -1% primarily due to lower
bonus, mostly offset by increased headcount
Note: $ in millions (unless noted), unaudited. Percentages and sums have been calculated using actual, non-rounded figures and, therefore, may not recalculate precisely.
Non-GAAP R&D -1% due to lower bonus and
product development costs, partially offset by
increased headcount
Non-GAAP Adjusted G&A +15% due to
increased headcount, partly offset by lower
bonusView entire presentation