J.P.Morgan Results Presentation Deck
Asset & Wealth Management¹
Selected income statement data ($mm)
Revenue
Asset Management
Global Private Bank
Expense
Credit costs
Net income²
Key drivers / statistics ($B)³
Equity
ROE
Pretax margin
Assets under management ("AUM")
Client assets
Average loans
Average deposits
1 See note 1 on slide 10
2 See note 3 on slide 11
3 Actual numbers for all periods, not over/(under)
2Q22
$4,306
2,137
2,169
2,919
44
$1,004
2Q22
$17.0
23%
31
$2,743
3,798
216.8
268.9
1Q22
($9)
(177)
168
298
59
333
(110)
54
($4) ($152)
1Q22
$17.0
O/(U)
23%
30
$2,960
4,116
214.6
287.8
2Q21
$199
(99)
2Q21
$14.0
32%
37
$2,987
4,044
195.2
219.7
7
CCB
CIB
CB
AWM Corp.
Financial performance
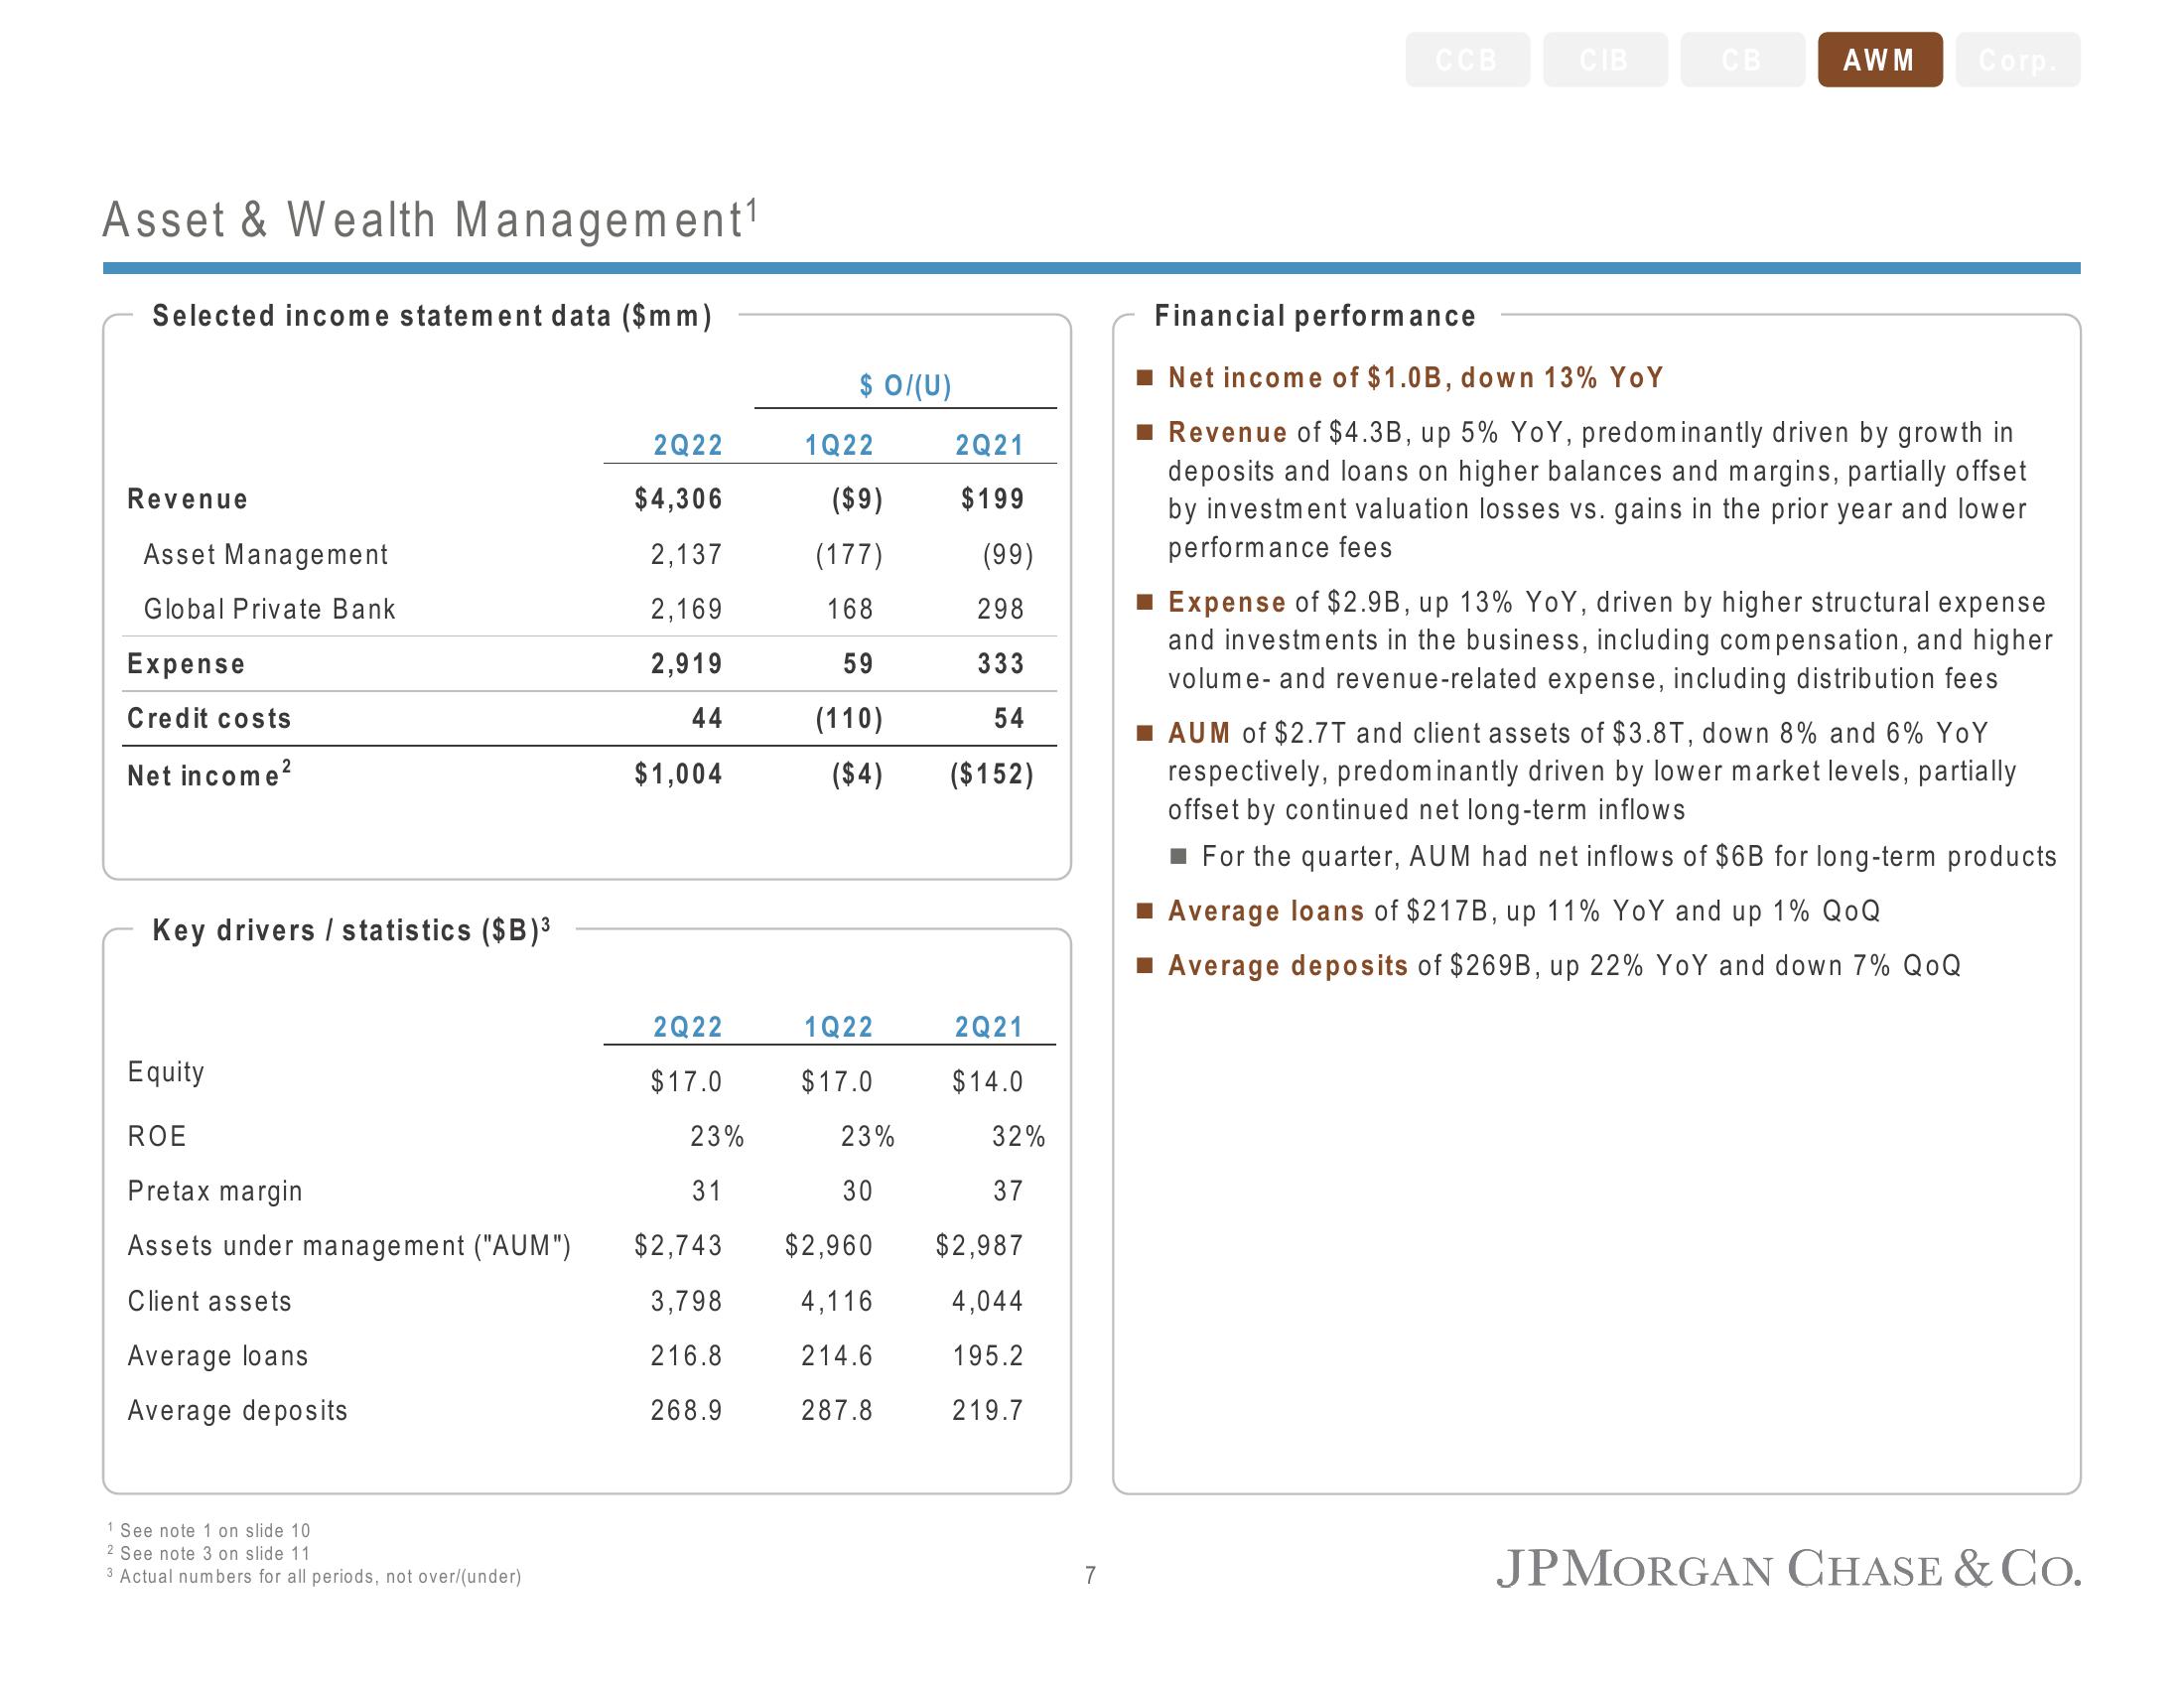
Net income of $1.0B, down 13% YoY
■ Revenue of $4.3B, up 5% YoY, predominantly driven by growth in
deposits and loans on higher balances and margins, partially offset
by investment valuation losses vs. gains in the prior year and lower
performance fees
■ Expense of $2.9B, up 13% YoY, driven by higher structural expense
and investments in the business, including compensation, and higher
volume- and revenue-related expense, including distribution fees
■AUM of $2.7T and client assets of $3.8T, down 8% and 6% YoY
respectively, predominantly driven by lower market levels, partially
offset by continued net long-term inflows
■ For the quarter, AUM had net inflows of $6B for long-term products
■ Average loans of $217B, up 11% YoY and up 1% QOQ
■ Average deposits of $269B, up 22% YoY and down 7% QOQ
JPMORGAN CHASE & Co.View entire presentation