Zegna Results Presentation Deck
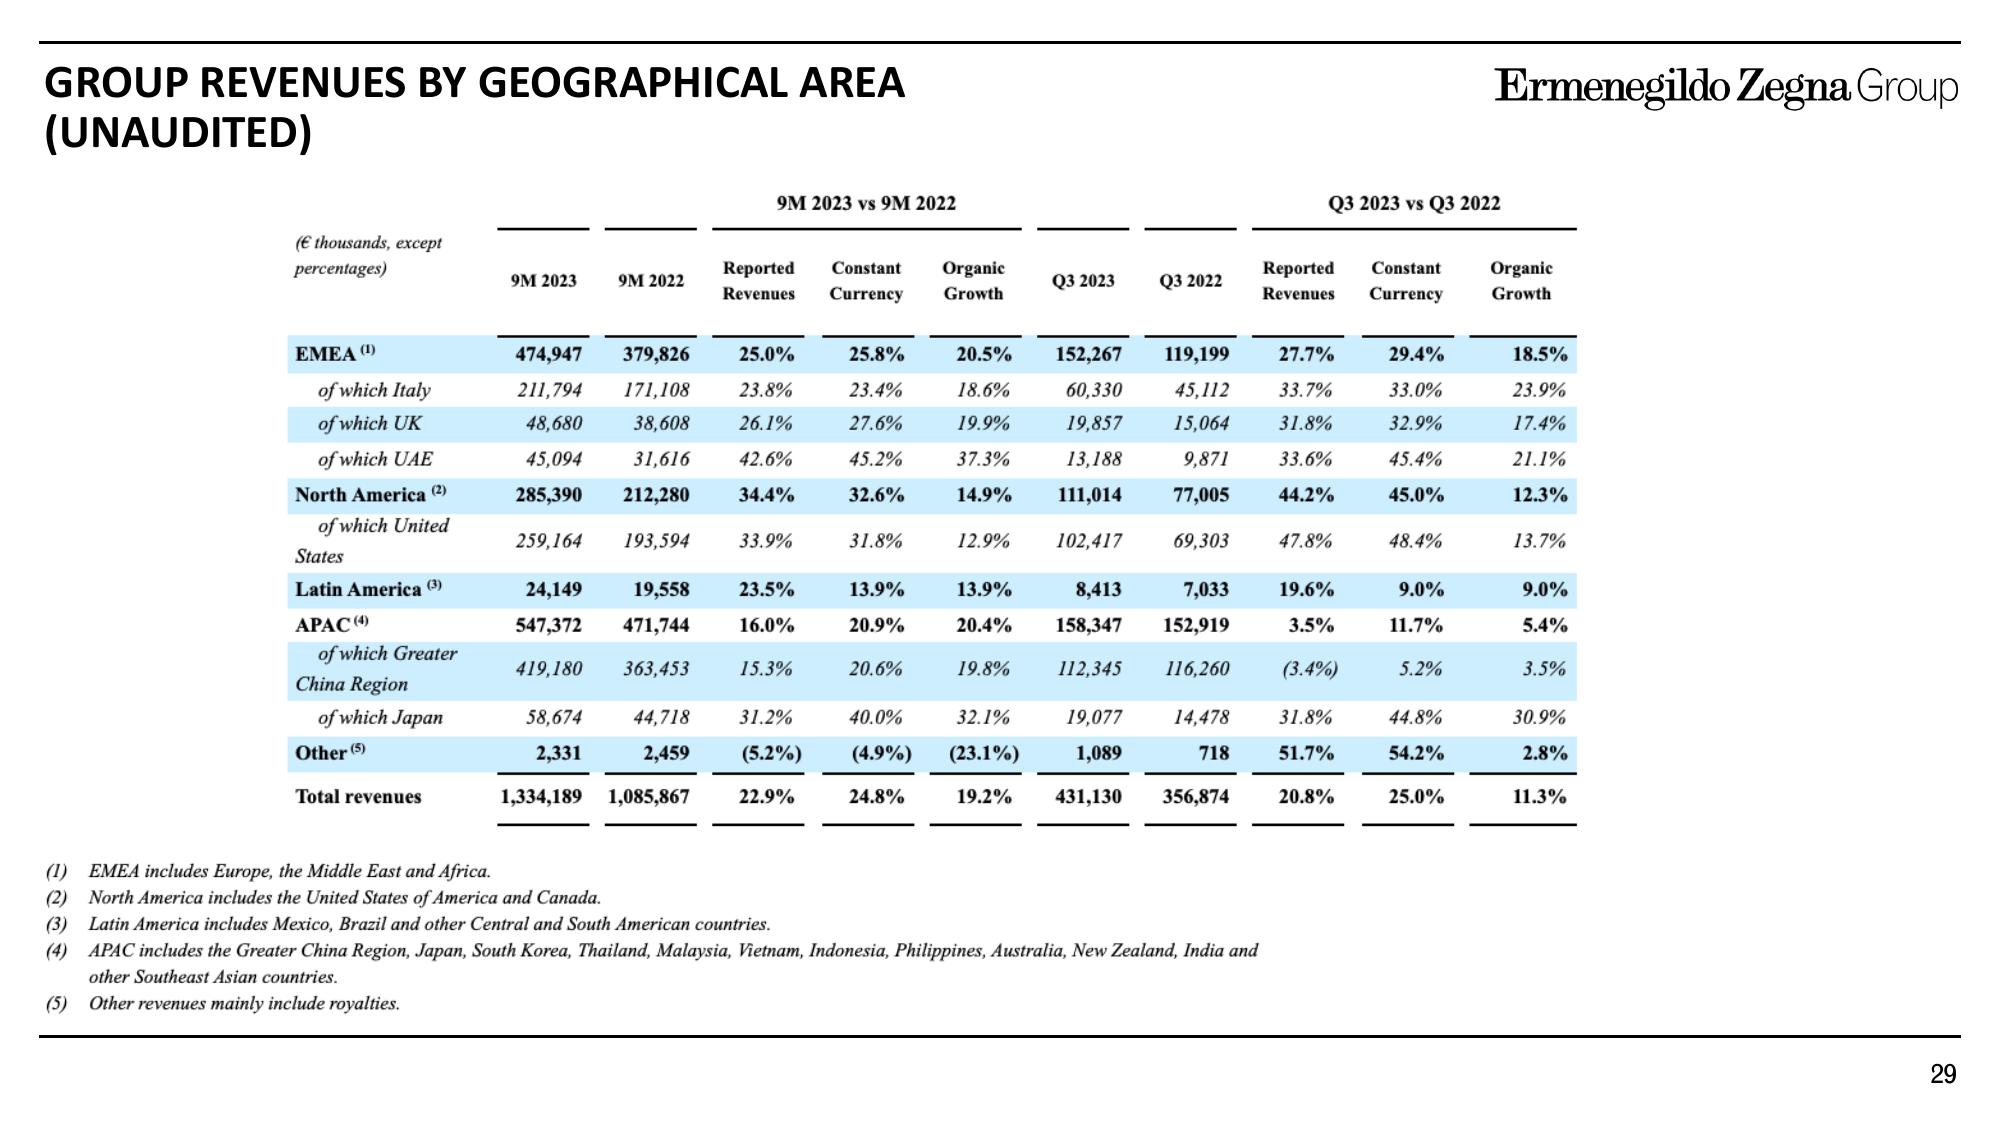
GROUP REVENUES BY GEOGRAPHICAL AREA
(UNAUDITED)
(€ thousands, except
percentages)
EMEA (¹)
of which Italy
of which UK
of which UAE
North America (2)
of which United
States
Latin America (3)
APAC (4)
of which Greater
China Region
of which Japan
Other (5)
Total revenues
9M 2023
474,947
211,794
48,680
45,094
285,390
259,164
24,149
547,372
419,180
58,674
2,331
9M 2022
193,594
379,826
171,108
25.0%
23.8%
38,608 26.1%
31,616
42.6%
212,280
34.4%
19,558
471,744
363,453
9M 2023 vs 9M 2022
44,718
2,459
Reported Constant
Revenues Currency
33.9%
23.5%
16.0%
15.3%
25.8%
23.4%
27.6%
45.2%
32.6%
1,334,189 1,085,867 22.9%
31.8%
13.9%
20.9%
20.6%
Organic
Growth
20.5% 152,267
18.6%
19.9%
60,330
19,857
13,188
111,014
37.3%
14.9%
102,417
12.9%
Q3 2023
31.2% 40.0% 32.1%
(5.2%) (4.9%) (23.1%)
24.8%
13.9%
8,413
20.4% 158,347
19.8%
Q3 2022
19,077
1,089
7,033
152,919
112,345 116,260
119,199
45,112
27.7%
33.7%
15,064 31.8%
9,871 33.6%
77,005 44.2%
69,303
47.8%
14,478
718
19.2% 431,130 356,874
(1) EMEA includes Europe, the Middle East and Africa.
(2) North America includes the United States of America and Canada.
(3) Latin America includes Mexico, Brazil and other Central and South American countries.
(4) APAC includes the Greater China Region, Japan, South Korea, Thailand, Malaysia, Vietnam, Indonesia, Philippines, Australia, New Zealand, India and
other Southeast Asian countries.
(5) Other revenues mainly include royalties.
Q3 2023 vs Q3 2022
Reported
Constant Organic
Revenues Currency Growth
19.6%
3.5%
(3.4%)
31.8%
51.7%
20.8%
29.4%
33.0%
32.9%
45.4%
45.0%
48.4%
9.0%
11.7%
5.2%
Ermenegildo Zegna Group
44.8%
54.2%
25.0%
18.5%
23.9%
17.4%
21.1%
12.3%
13.7%
9.0%
5.4%
3.5%
30.9%
2.8%
11.3%
29View entire presentation