Second Quarter 2017 Conference Call
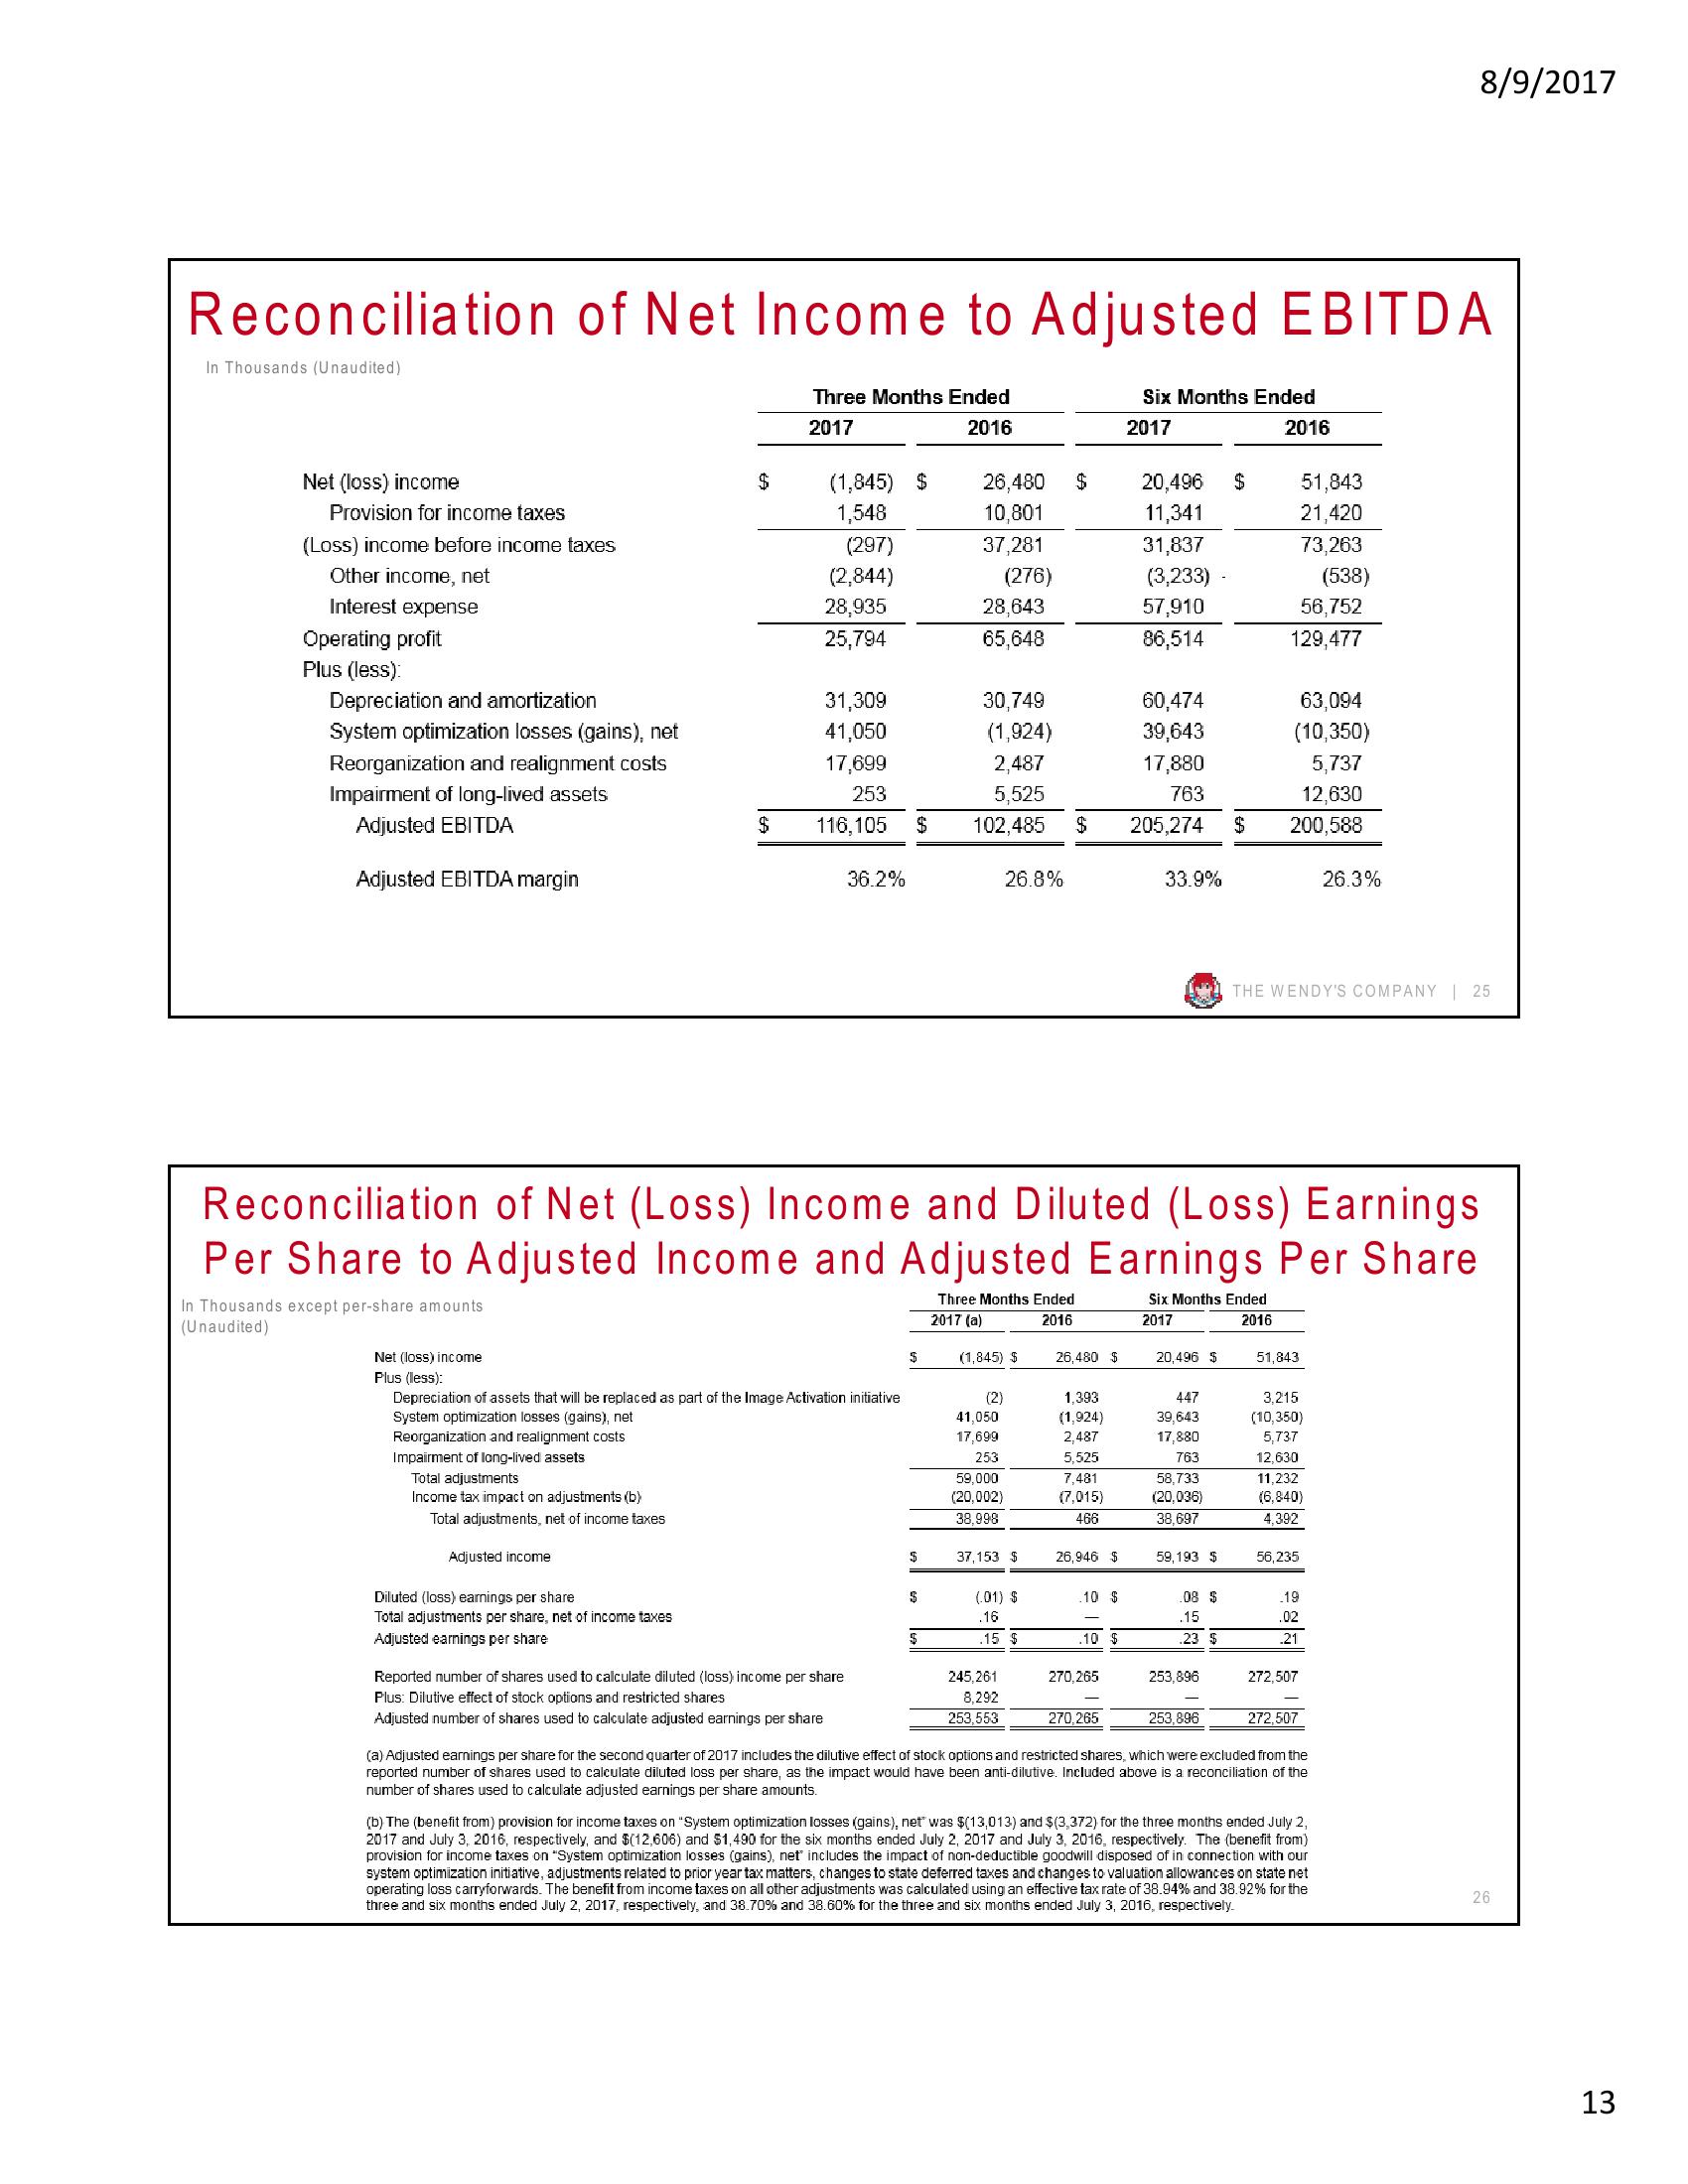
Reconciliation of Net Income to Adjusted EBITDA
In Thousands (Unaudited)
Net (loss) income
Provision for income taxes
(Loss) income before income taxes
Other income, net
Interest expense
Operating profit
Plus (less):
Depreciation and amortization
System optimization losses (gains), net
Reorganization and realignment costs
Impairment of long-lived assets
Adjusted EBITDA
Adjusted EBITDA margin
In Thousands except per-share amounts
(Unaudited)
Reorganization and realignment costs
Impairment of long-lived assets
Total adjustments
Income tax impact on adjustments (b)
Total adjustments, net of income taxes
$
Adjusted income
$
Diluted (loss) earnings per share
Total adjustments per share, net of income taxes
Adjusted earnings per share
Three Months Ended
2017
2016
(1,845) $
1,548
(297)
(2,844)
28,935
25,794
31,309
41,050
17,699
253
116,105
Net (loss) income
Plus (less):
Depreciation of assets that will be replaced as part of the Image Activation initiative
System optimization losses (gains), net
36.2%
Reported number of shares used to calculate diluted (loss) income per share
Plus: Dilutive effect of stock options and restricted shares
Adjusted number of shares used to calculate adjusted earnings per share
$
$
$
26,480
10,801
37,281
$
(276)
28,643
65,648
26.8%
(1,845) $
(2)
41,050
17,699
253
59,000
(20,002)
38,998
30,749
(1,924)
2,487
5,525
102,485 $ 205,274 $
Reconciliation of Net (Loss) Income and Diluted (Loss) Earnings
Per Share to Adjusted Income and Adjusted Earnings Per Share
Three Months Ended
2017 (a)
2016
Six Months Ended
2017
2016
37.153 $
245,261
8,292
253,553
$
(01) $
.16
.15 $
26,480 $
1.393
(1,924)
2,487
5,525
7,481
(7,015)
466
26,946 $
10 $
.10 $
Six Months Ended
2017
2016
270,265
20,496 $
11,341
31,837
(3,233)
57,910
86,514
270,265
60,474
39,643
17,880
763
33.9%
20,496 $
447
39,643
17,880
763
58,733
(20,036)
38,697
59,193 $
.08 $
.15
.23 $
253,896
253,896
56,752
129,477
51,843
21,420
73,263
63,094
(10,350)
5,737
12,630
200,588
51,843
THE WENDY'S COMPANY | 25
3,215
(10,350)
5,737
12,630
11,232
(6,840)
4,392
56,235
.19
.02
.21
(538)
272,507
272,507
(a) Adjusted earnings per share for the second quarter of 2017 includes the dilutive effect of stock options and restricted shares, which were excluded from the
reported number of shares used to calculate diluted loss per share, as the impact would have been anti-dilutive. Included above is a reconciliation of the
number of shares used to calculate adjusted earnings per share amounts.
8/9/2017
26.3%
(b) The (benefit from) provision for income taxes on "System optimization losses (gains), net was $(13,013) and $(3,372) for the three months ended July 2,
2017 and July 3, 2016, respectively, and $(12,606) and $1,490 for the six months ended July 2, 2017 and July 3, 2016, respectively. The (benefit from)
provision for income taxes on "System optimization losses (gains), net includes the impact of non-deductible goodwill disposed of in connection with our
system optimization initiative, adjustments related to prior year tax matters, changes to state deferred taxes and changes to valuation allowances on state net
operating loss carryforwards. The benefit from income taxes on all other adjustments was calculated using an effective tax rate of 38.94% and 38.92% for the
three and six months ended July 2, 2017, respectively, and 38.70% and 38.60% for the three and six months ended July 3, 2016, respectively.
26
13View entire presentation