Uber Results Presentation Deck
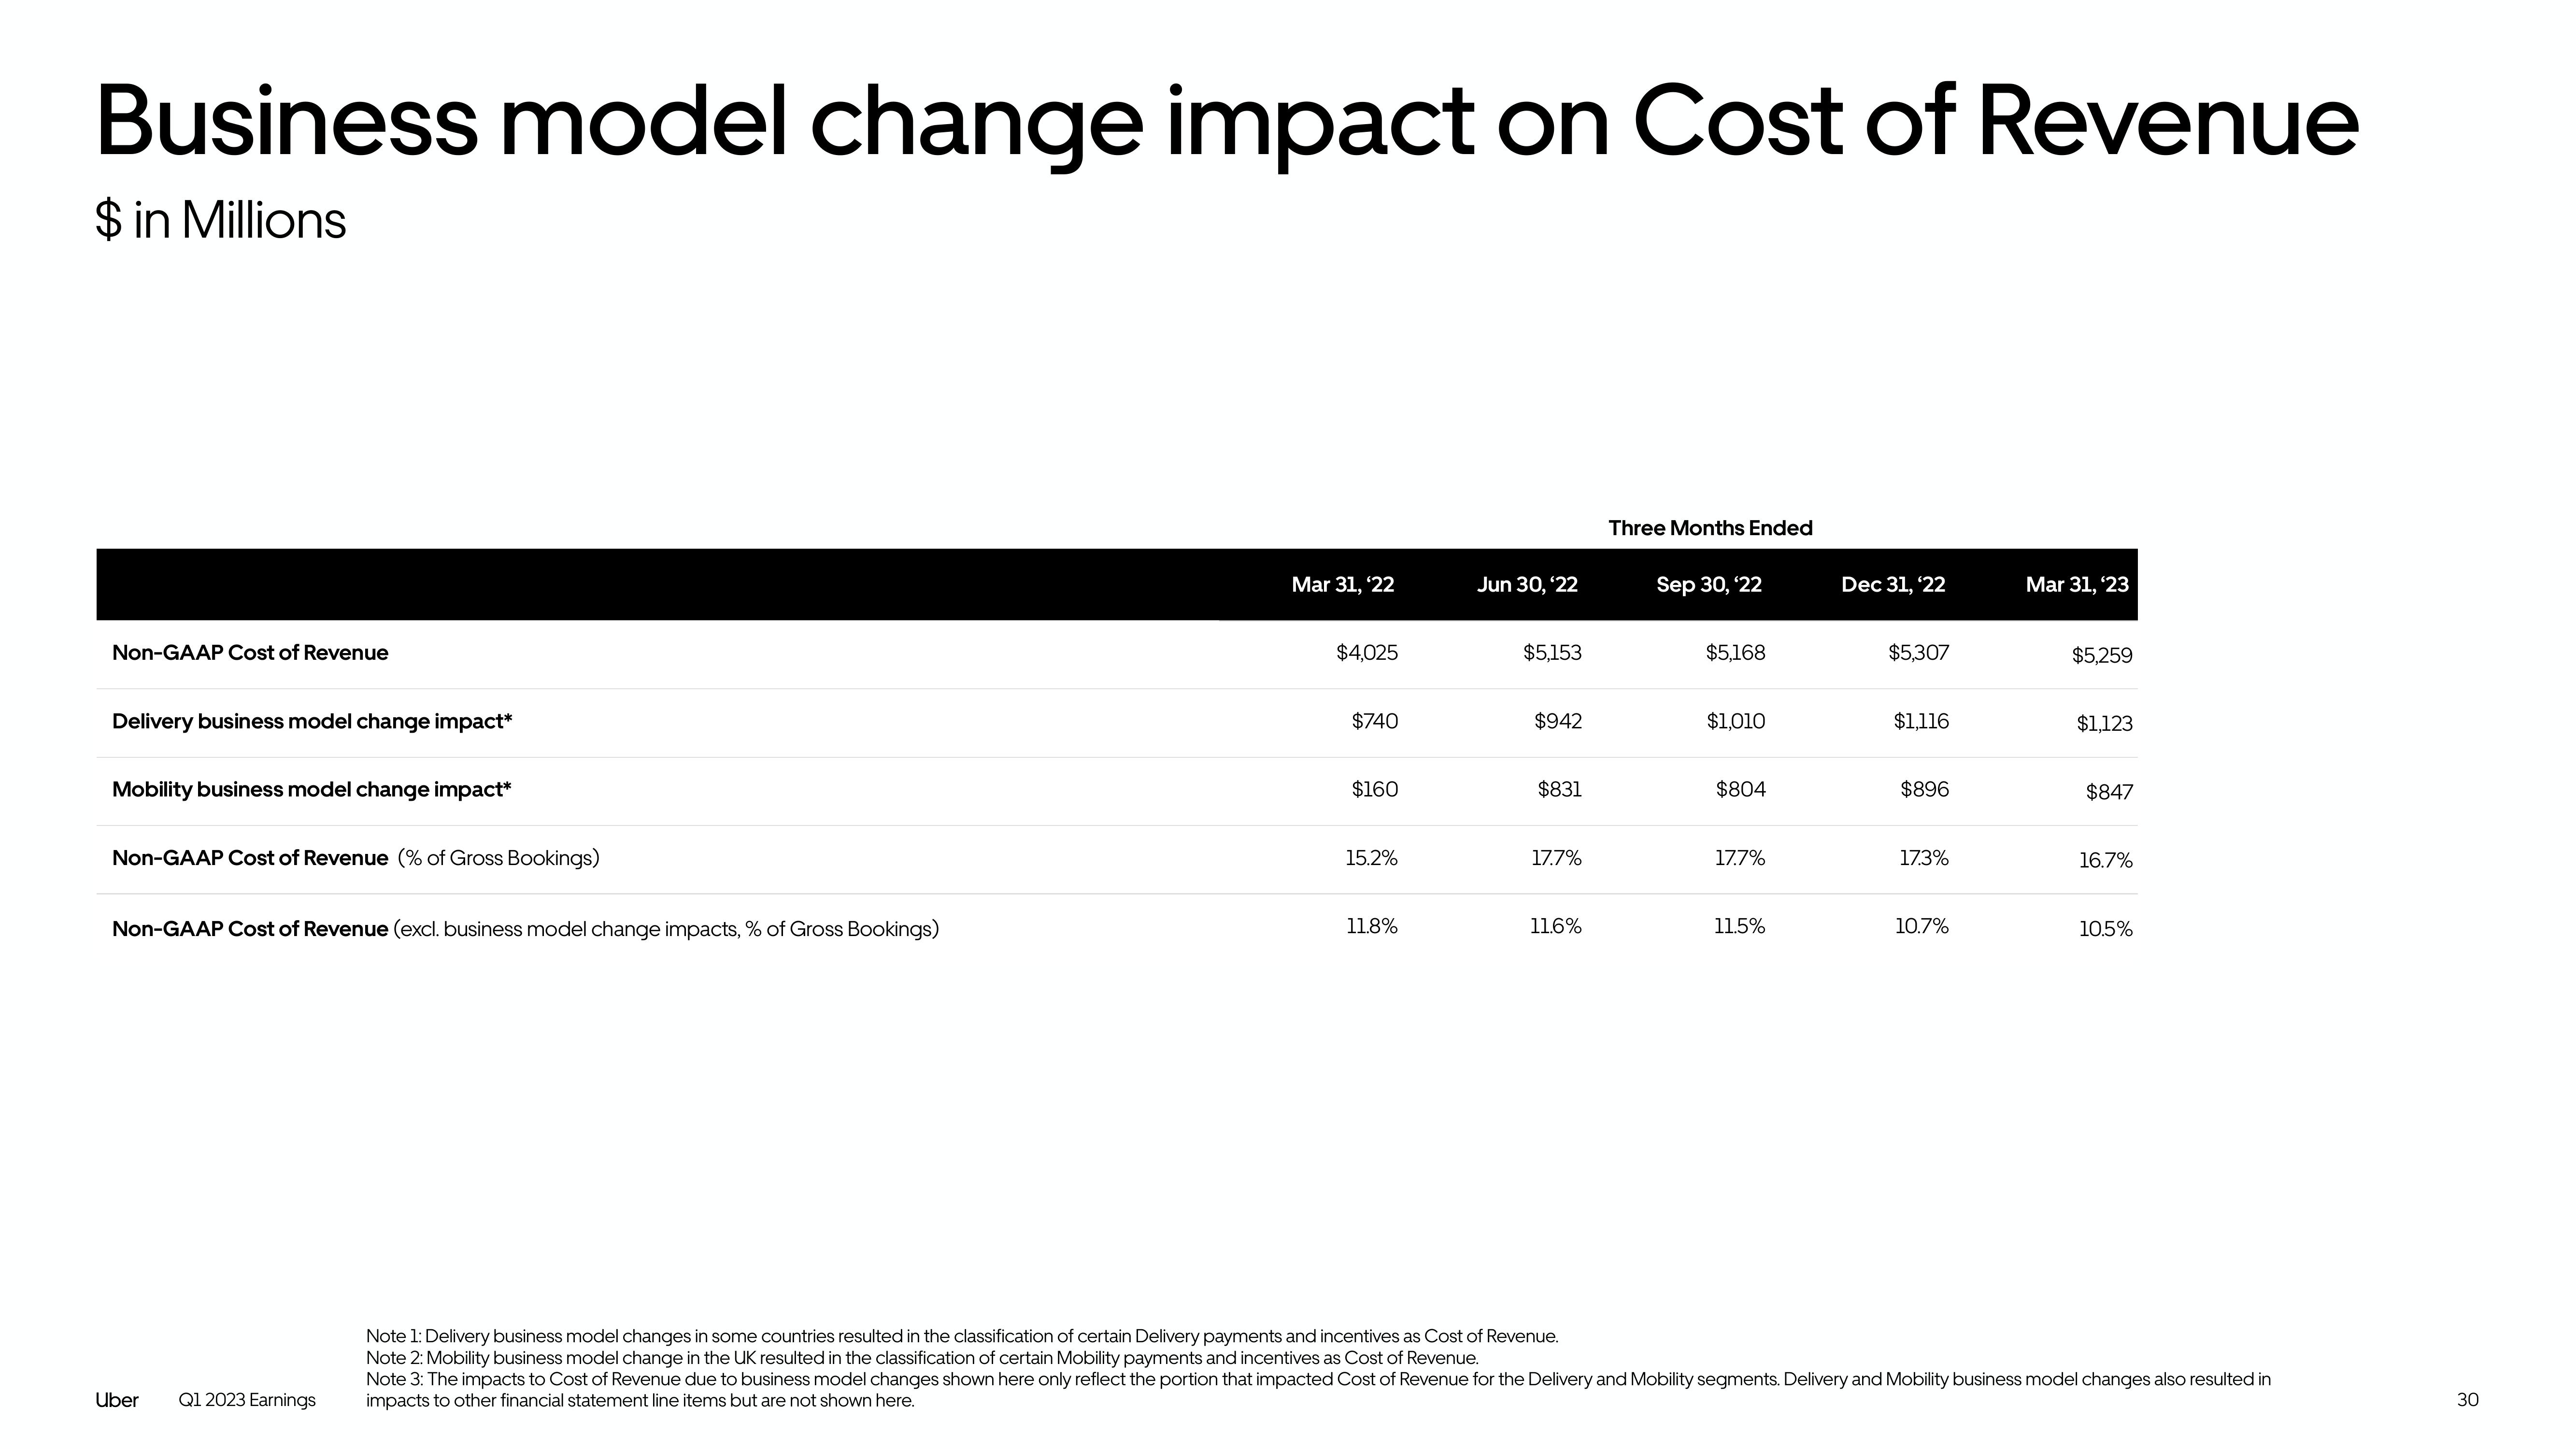
Business model change impact on Cost of Revenue
$ in Millions
Non-GAAP Cost of Revenue
Delivery business model change impact*
Mobility business model change impact*
Non-GAAP Cost of Revenue (% of Gross Bookings)
Non-GAAP Cost of Revenue (excl. business model change impacts, % of Gross Bookings)
Uber
Q1 2023 Earnings
Mar 31, '22
$4,025
$740
$160
15.2%
11.8%
Jun 30, '22
$5,153
$942
$831
17.7%
11.6%
Note 1: Delivery business model changes in some countries resulted in the classification of certain Delivery payments and incentives as Cost of Revenue.
Note 2: Mobility business model change in the UK resulted in the classification of certain Mobility payments and incentives as Cost of Revenue.
Three Months Ended
Sep 30, '22
$5,168
$1,010
$804
17.7%
11.5%
Dec 31, '22
$5,307
$1,116
$896
17.3%
10.7%
Mar 31, '23
$5,259
$1,123
$847
16.7%
10.5%
Note 3: The impacts to Cost of Revenue due to business model changes shown here only reflect the portion that impacted Cost of Revenue for the Delivery and Mobility segments. Delivery and Mobility business model changes also resulted in
impacts to other financial statement line items but are not shown here.
30View entire presentation