HashiCorp Investor Presentation Deck
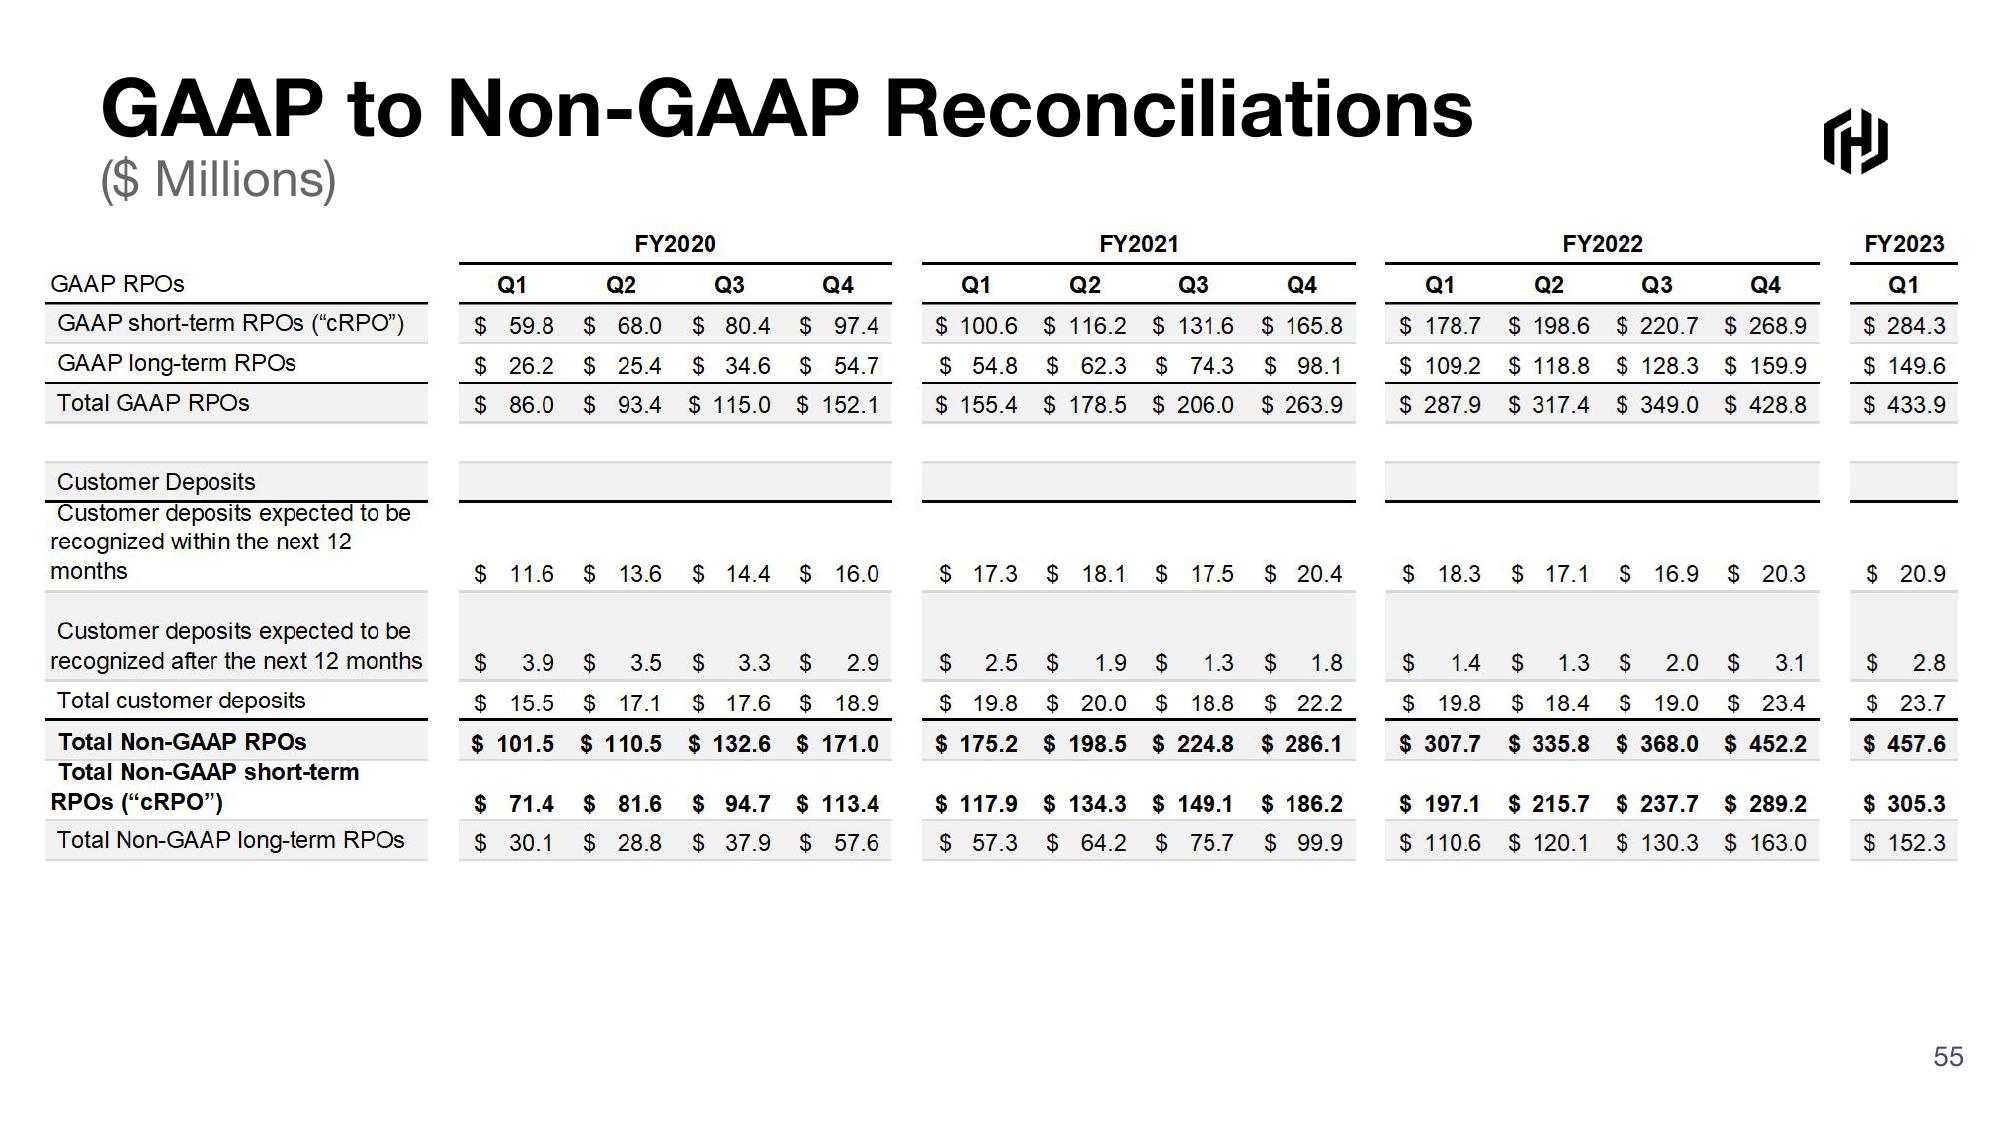
GAAP to Non-GAAP Reconciliations
($ Millions)
GAAP RPOS
GAAP short-term RPOS ("cRPO")
GAAP long-term RPOS
Total GAAP RPOS
Customer Deposits
Customer deposits expected to be
recognized within the next 12
months
Customer deposits expected to be
recognized after the next 12 months
Total customer deposits
Total Non-GAAP RPOS
Total Non-GAAP short-term
RPOS ("CRPO")
Total Non-GAAP long-term RPOS
FY2020
Q1
Q2
$ 59.8
$26.2
$68.0
$25.4
$ 86.0 $93.4
$11.6
$13.6
$ 3.9 $ 3.5
$15.5 $ 17.1
$ 101.5 $ 110.5
$ 71.4 $81.6
$ 30.1 $28.8
Q3
Q4
$ 80.4 $97.4
$ 34.6 $ 54.7
$115.0 $ 152.1
$14.4 $ 16.0
$ 3.3 $ 2.9
$17.6 $ 18.9
$132.6 $ 171.0
$94.7 $113.4
$ 37.9 $ 57.6
FY2021
Q1
Q2
Q3
$ 100.6 $116.2 $ 131.6
$ 54.8 $ 62.3 $ 74.3
$155.4 $178.5 $206.0
$ 17.3 $ 18.1
$ 2.5 $ 1.9
$19.8 $20.0
$ 175.2 $ 198.5
Q4
$165.8
$98.1
$ 263.9
$17.5 $ 20.4
$ 1.3 $ 1.8
$18.8 $22.2
$ 224.8 $ 286.1
$117.9 $134.3 $149.1
$ 57.3 $ 64.2 $ 75.7
$ 186.2
$ 99.9
Q1
$ 178.7
$ 109.2
$ 287.9
$18.3
FY2022
$ 197.1
$ 110.6
Q2
Q3
Q4
$198.6 $220.7 $ 268.9
$ 118.8 $128.3 $ 159.9
$317.4 $ 349.0 $ 428.8
$ 17.1
$ 1.4 $ 1.3 $ 2.0 $ 3.1
$19.8 $18.4 $ 19.0 $ 23.4
$ 307.7 $335.8 $ 368.0 $ 452.2
$16.9 $ 20.3
$ 215.7
$ 120.1
$ 237.7 $289.2
$ 130.3 $ 163.0
Q
FY2023
Q1
$ 284.3
$149.6
$ 433.9
$20.9
$ 2.8
$23.7
$ 457.6
$ 305.3
$152.3
55View entire presentation