J.P.Morgan 2Q23 Investor Results
JPMORGAN CHASE & CO.
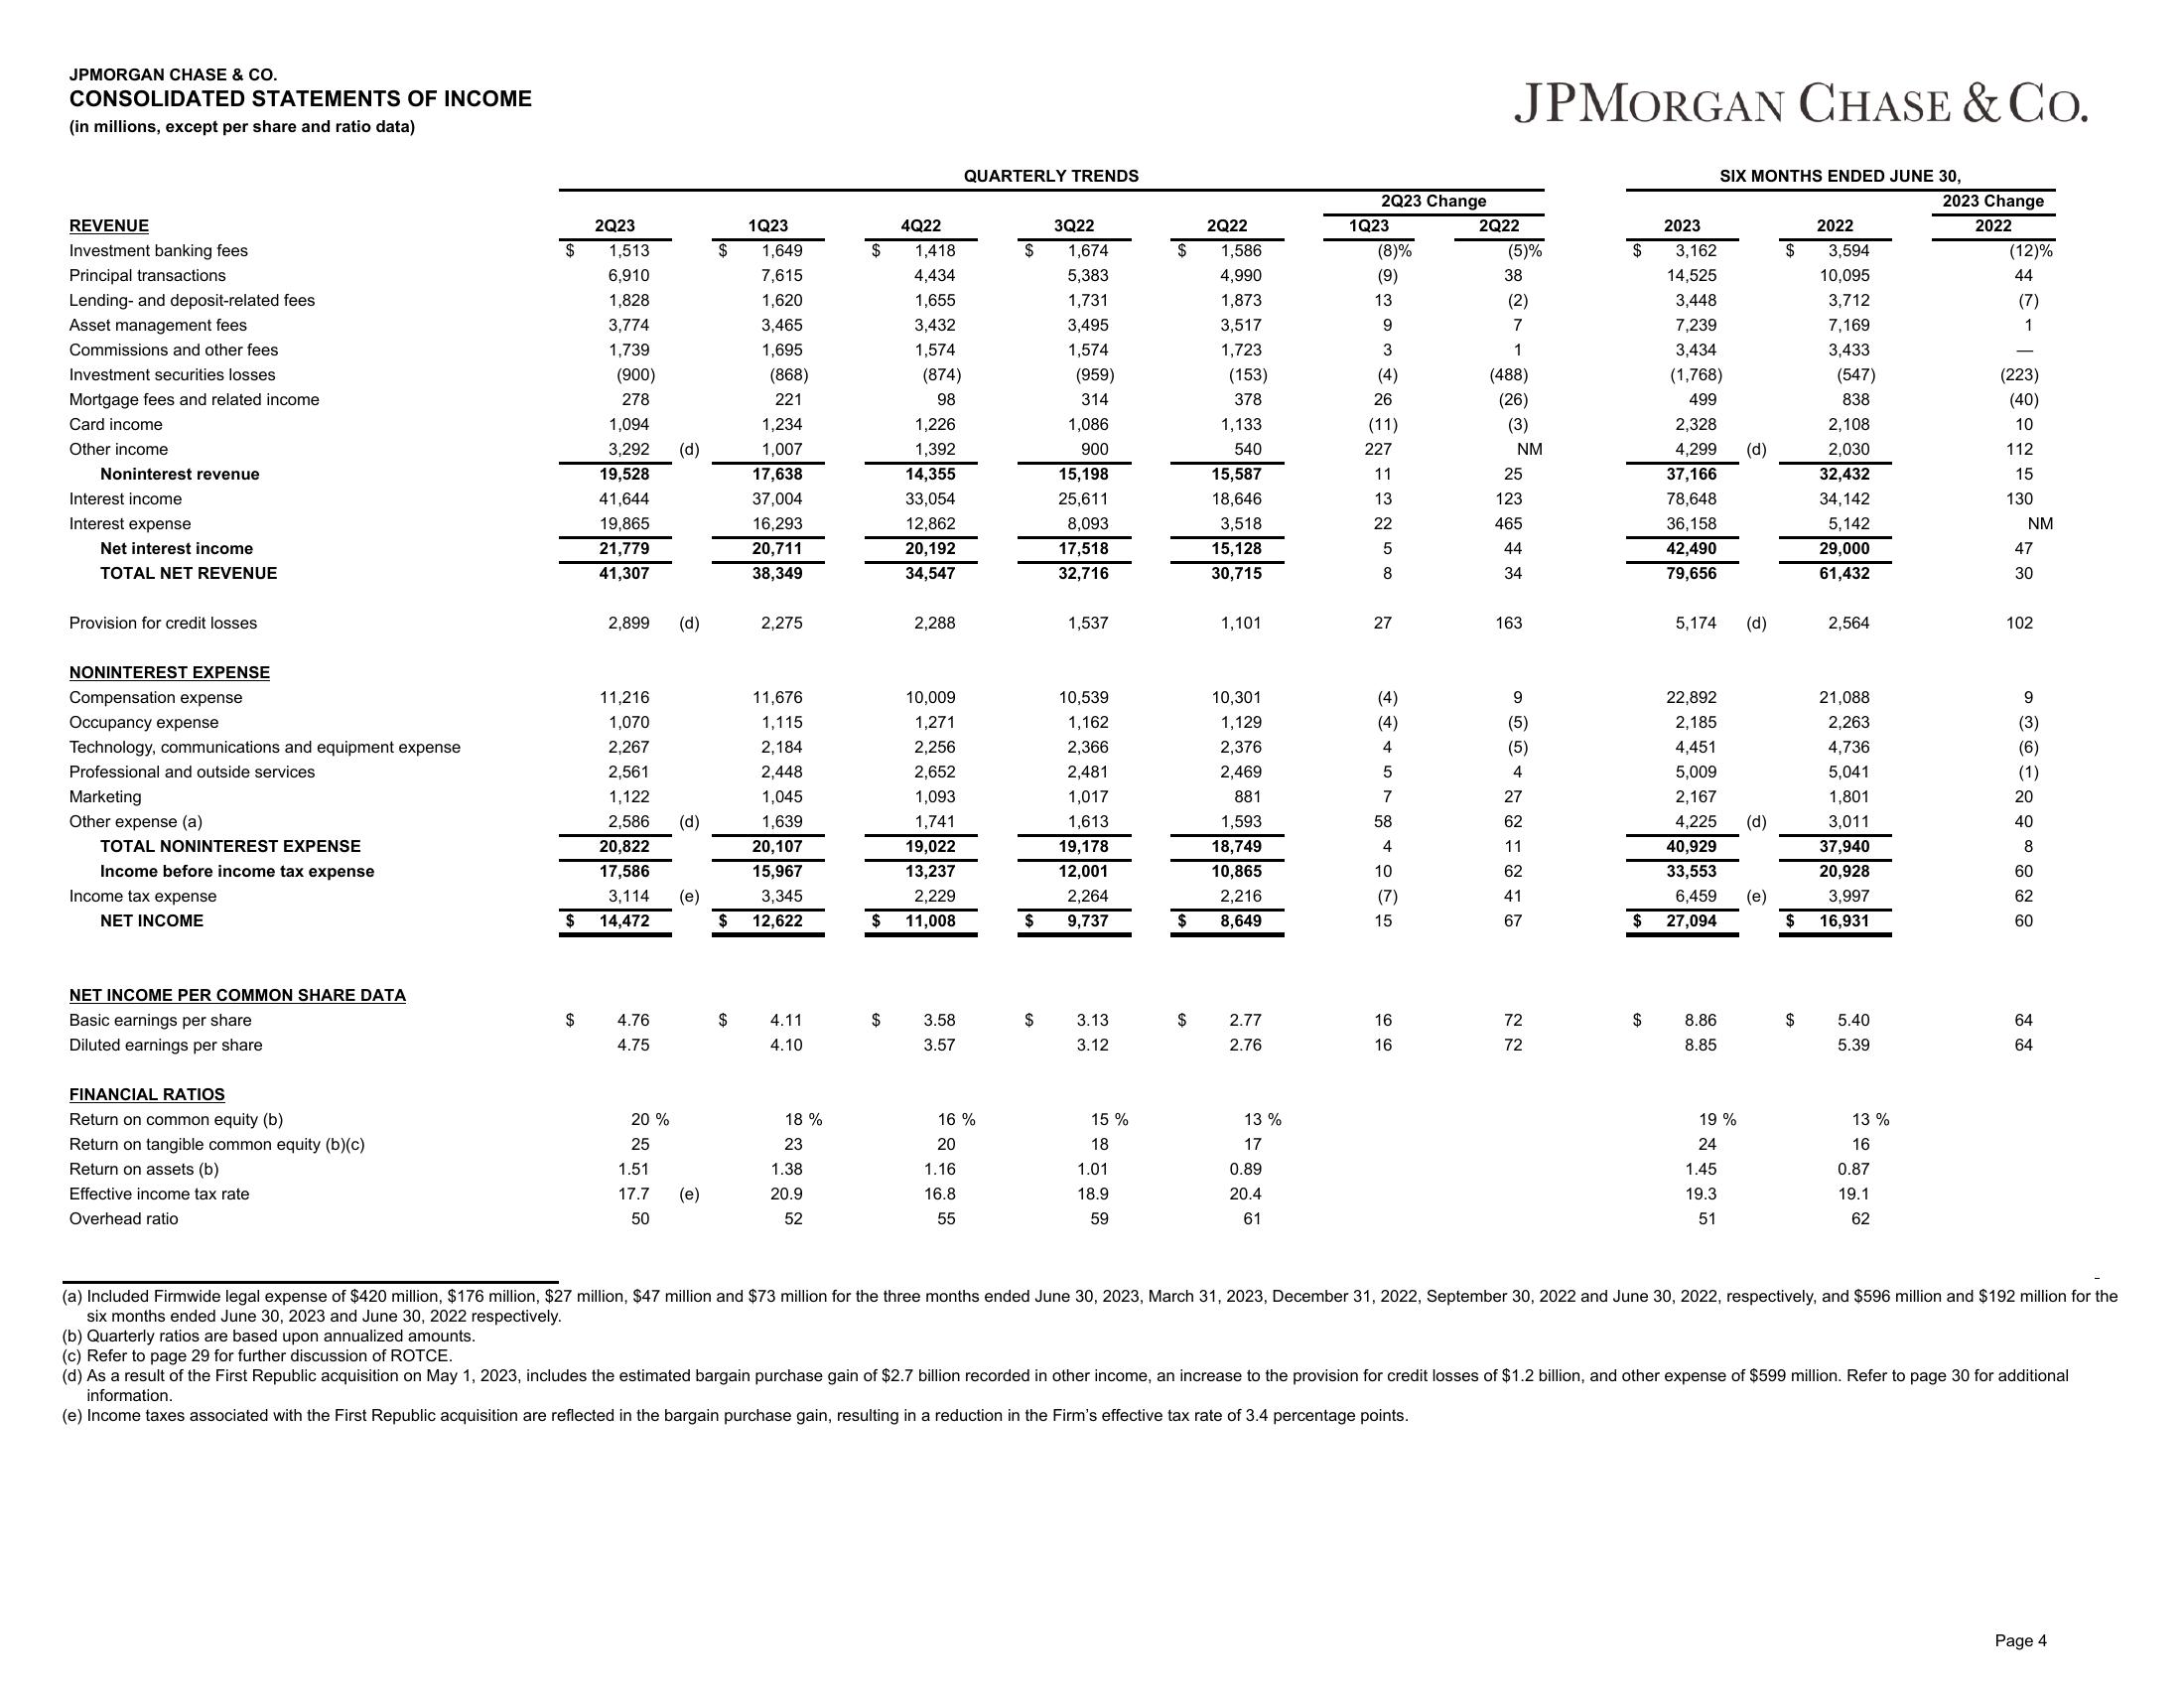
CONSOLIDATED STATEMENTS OF INCOME
(in millions, except per share and ratio data)
REVENUE
Investment banking fees
Principal transactions
Lending- and deposit-related fees
Asset management fees
Commissions and other fees
Investment securities losses
Mortgage fees and related income
Card income
Other income
Noninterest revenue
Interest income
Interest expense
Net interest income
TOTAL NET REVENUE
Provision for credit losses
NONINTEREST EXPENSE
Compensation expense
Occupancy expense
Technology, communications and equipment expense
Professional and outside services
Marketing
Other expense (a)
TOTAL NONINTEREST EXPENSE
Income before income tax expense
Income tax expense
NET INCOME
NET INCOME PER COMMON SHARE DATA
Basic earnings per share
Diluted earnings per share
FINANCIAL RATIOS
Return on common equity (b)
Return on tangible common equity (b)(c)
Return on assets (b)
Effective income tax rate
Overhead ratio
2Q23
$
1,513
6,910
1,828
3,774
1,739
(900)
278
1,094
3,292 (d)
19,528
41,644
19,865
21,779
41,307
2,899 (d)
11,216
1,070
2,267
2,561
1,122
2,586 (d)
20,822
17,586
3,114
$ 14,472
4.76
4.75
20 %
25
1.51
17.7
50
(e)
$
1Q23
$
1,649
7,615
1,620
3,465
1,695
(868)
221
1,234
1,007
17,638
37,004
16,293
20,711
38,349
2,275
11,676
1,115
2,184
2,448
1,045
1,639
20,107
15,967
3,345
$ 12,622
4.11
4.10
18 %
23
1.38
20.9
52
$
$
4Q22
1,418
4,434
1,655
3,432
1,574
(874)
98
1,226
1,392
14,355
33,054
12,862
20,192
34,547
2,288
10,009
1,271
2,256
2,652
1,093
1,741
19,022
13,237
2,229
11,008
3.58
3.57
QUARTERLY TRENDS
16 %
20
1.16
16.8
55
$
$
$
3Q22
1,674
5,383
1,731
3,495
1,574
(959)
314
1,086
900
15,198
25,611
8,093
17,518
32,716
1,537
10,539
1,162
2,366
2,481
1,017
1,613
19,178
12,001
2,264
9,737
3.13
3.12
15 %
18
1.01
18.9
59
$
$
$
2Q22
1,586
4,990
1,873
3,517
1,723
(153)
378
1,133
540
15,587
18,646
3,518
15,128
30,715
1,101
10,301
1,129
2,376
2,469
881
1,593
18,749
10,865
2,216
8,649
2.77
2.76
13 %
17
0.89
20.4
61
2Q23 Change
1Q23
(8)%
(9)
13
9
3
(4)
26
(11)
227
11
13
22
5
8
27
(4)
4
5
7
58
4
10
(7)
15
16
16
JPMORGAN CHASE & CO.
2Q22
2023
$ 3,162
$ 3,594
14,525
10,095
(2)
3,448
3,712
7
7,239
7,169
1
3,434
3,433
(488)
(1,768)
(547)
111
(26)
499
838
(3)
2,328
2,108
NM
4,299 (d)
2,030
25
37,166
32,432
78,648
34,142
36,158
5,142
42,490
79,656
(5)%
38
123
465
44
34
163
9
(5)
(5)
4
27
62
11
62
41
67
72
72
$
$
5,174
SIX MONTHS ENDED JUNE 30,
8.86
8.85
22,892
2,185
4,451
5,009
2,167
4,225
40,929
33,553
6,459 (e)
27,094
19%
24
1.45
19.3
51
(d)
(d)
$
$
2022
29,000
61,432
2,564
21,088
2,263
4,736
5,041
1,801
3,011
37,940
20,928
3,997
16,931
5.40
5.39
13 %
16
0.87
19.1
62
2023 Change
2022
(12)%
44
(7)
1
(223)
(40)
10
112
15
130
NM
47
30
102
9
(3)
(6)
(1)
20
40
8
60
62
60
64
64
(a) Included Firmwide legal expense of $420 million, $176 million, $27 million, $47 million and $73 million for the three months ended June 30, 2023, March 31, 2023, December 31, 2022, September 30, 2022 and June 30, 2022, respectively, and $596 million and $192 million for the
six months ended June 30, 2023 and June 30, 2022 respectively.
(b) Quarterly ratios are based upon annualized amounts.
(c) Refer to page 29 for further discussion of ROTCE.
(d) As a result of the First Republic acquisition on May 1, 2023, includes the estimated bargain purchase gain of $2.7 billion recorded in other income, an increase to the provision for credit losses of $1.2 billion, and other expense of $599 million. Refer to page 30 for additional
information.
(e) Income taxes associated with the First Republic acquisition are reflected in the bargain purchase gain, resulting in a reduction in the Firm's effective tax rate of 3.4 percentage points.
Page 4View entire presentation