Clover Health SPAC Presentation Deck
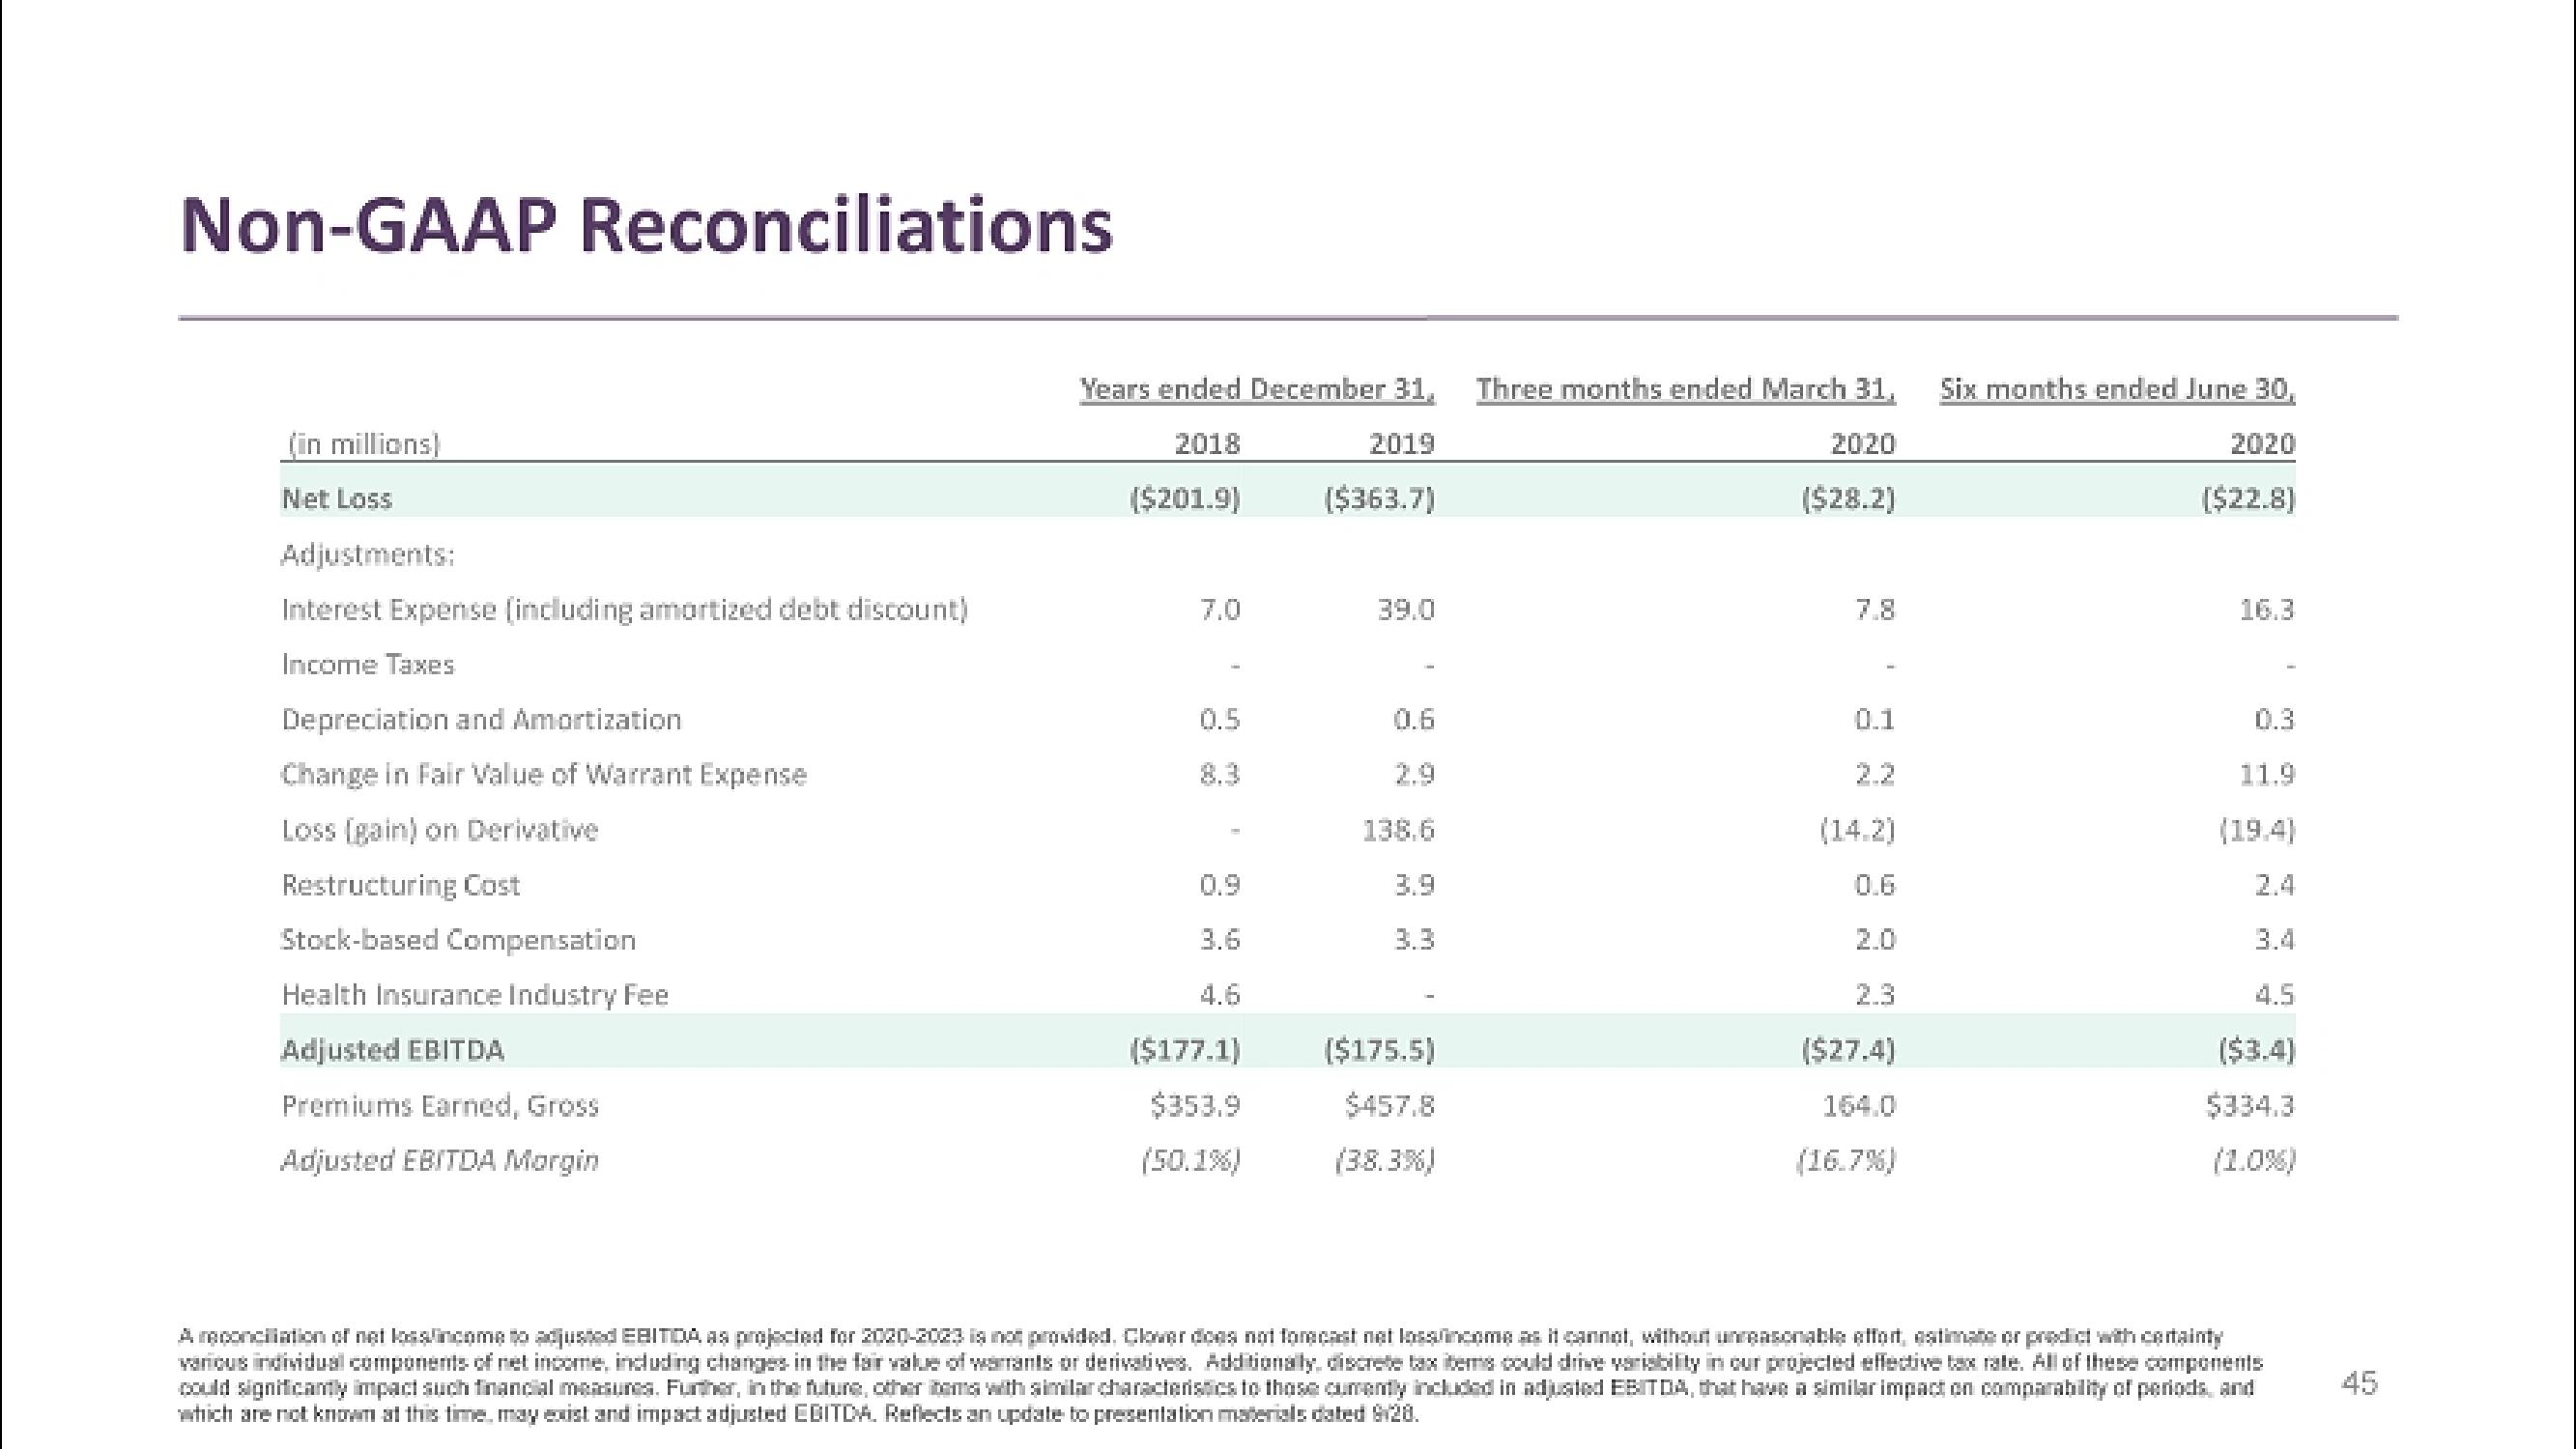
Non-GAAP Reconciliations
(in millions)
Net Loss
Adjustments:
Interest Expense (including amortized debt discount)
Income Taxes
Depreciation and Amortization
Change in Fair Value of Warrant Expense
Loss (gain) on Derivative
Restructuring Cost
Stock-based Compensation
Health Insurance Industry Fee
Adjusted EBITDA
Premiums Earned, Gross
Adjusted EBITDA Margin
Years ended December 31, Three months ended March 31, Six months ended June 30,
2018
2019
2020
2020
($201.9)
($363.7)
($28.2)
[$22.8]
0.5
3.6
($177.1)
$353.9
(50.1%)
39.0
0.6
138.6
3.9
3.3
($175.5)
$457.8
(38.3%)
7.8
0.1
($27.4)
164.0
(16.7%)
16.3
0.3
11.9
(19.4)
4.5
($3.4)
$334.3
A reconciliation of net loss/income to adjusted EBITDA, as projected for 2020-2023 is not provided. Clower does not forecast not loss income as it cannot, without unreasonable effort, estimate or predict with certainty
various individual components of net income, including changes in the fair value of warrants or derivatives. Additionally, discrete tax items could drive variability in our projected effective tax rate. All of these components
could significantly impact such financial measures. Further, in the future, other items with similar characteristics to those currently included in adjusted EBITDA, that have a similar impact on comparability of periods, and
which are not known at this time, may exist and impact adjusted EBITDA. Reflects an update to presentation materials dated 928.
45View entire presentation