Allego Investor Presentation Deck
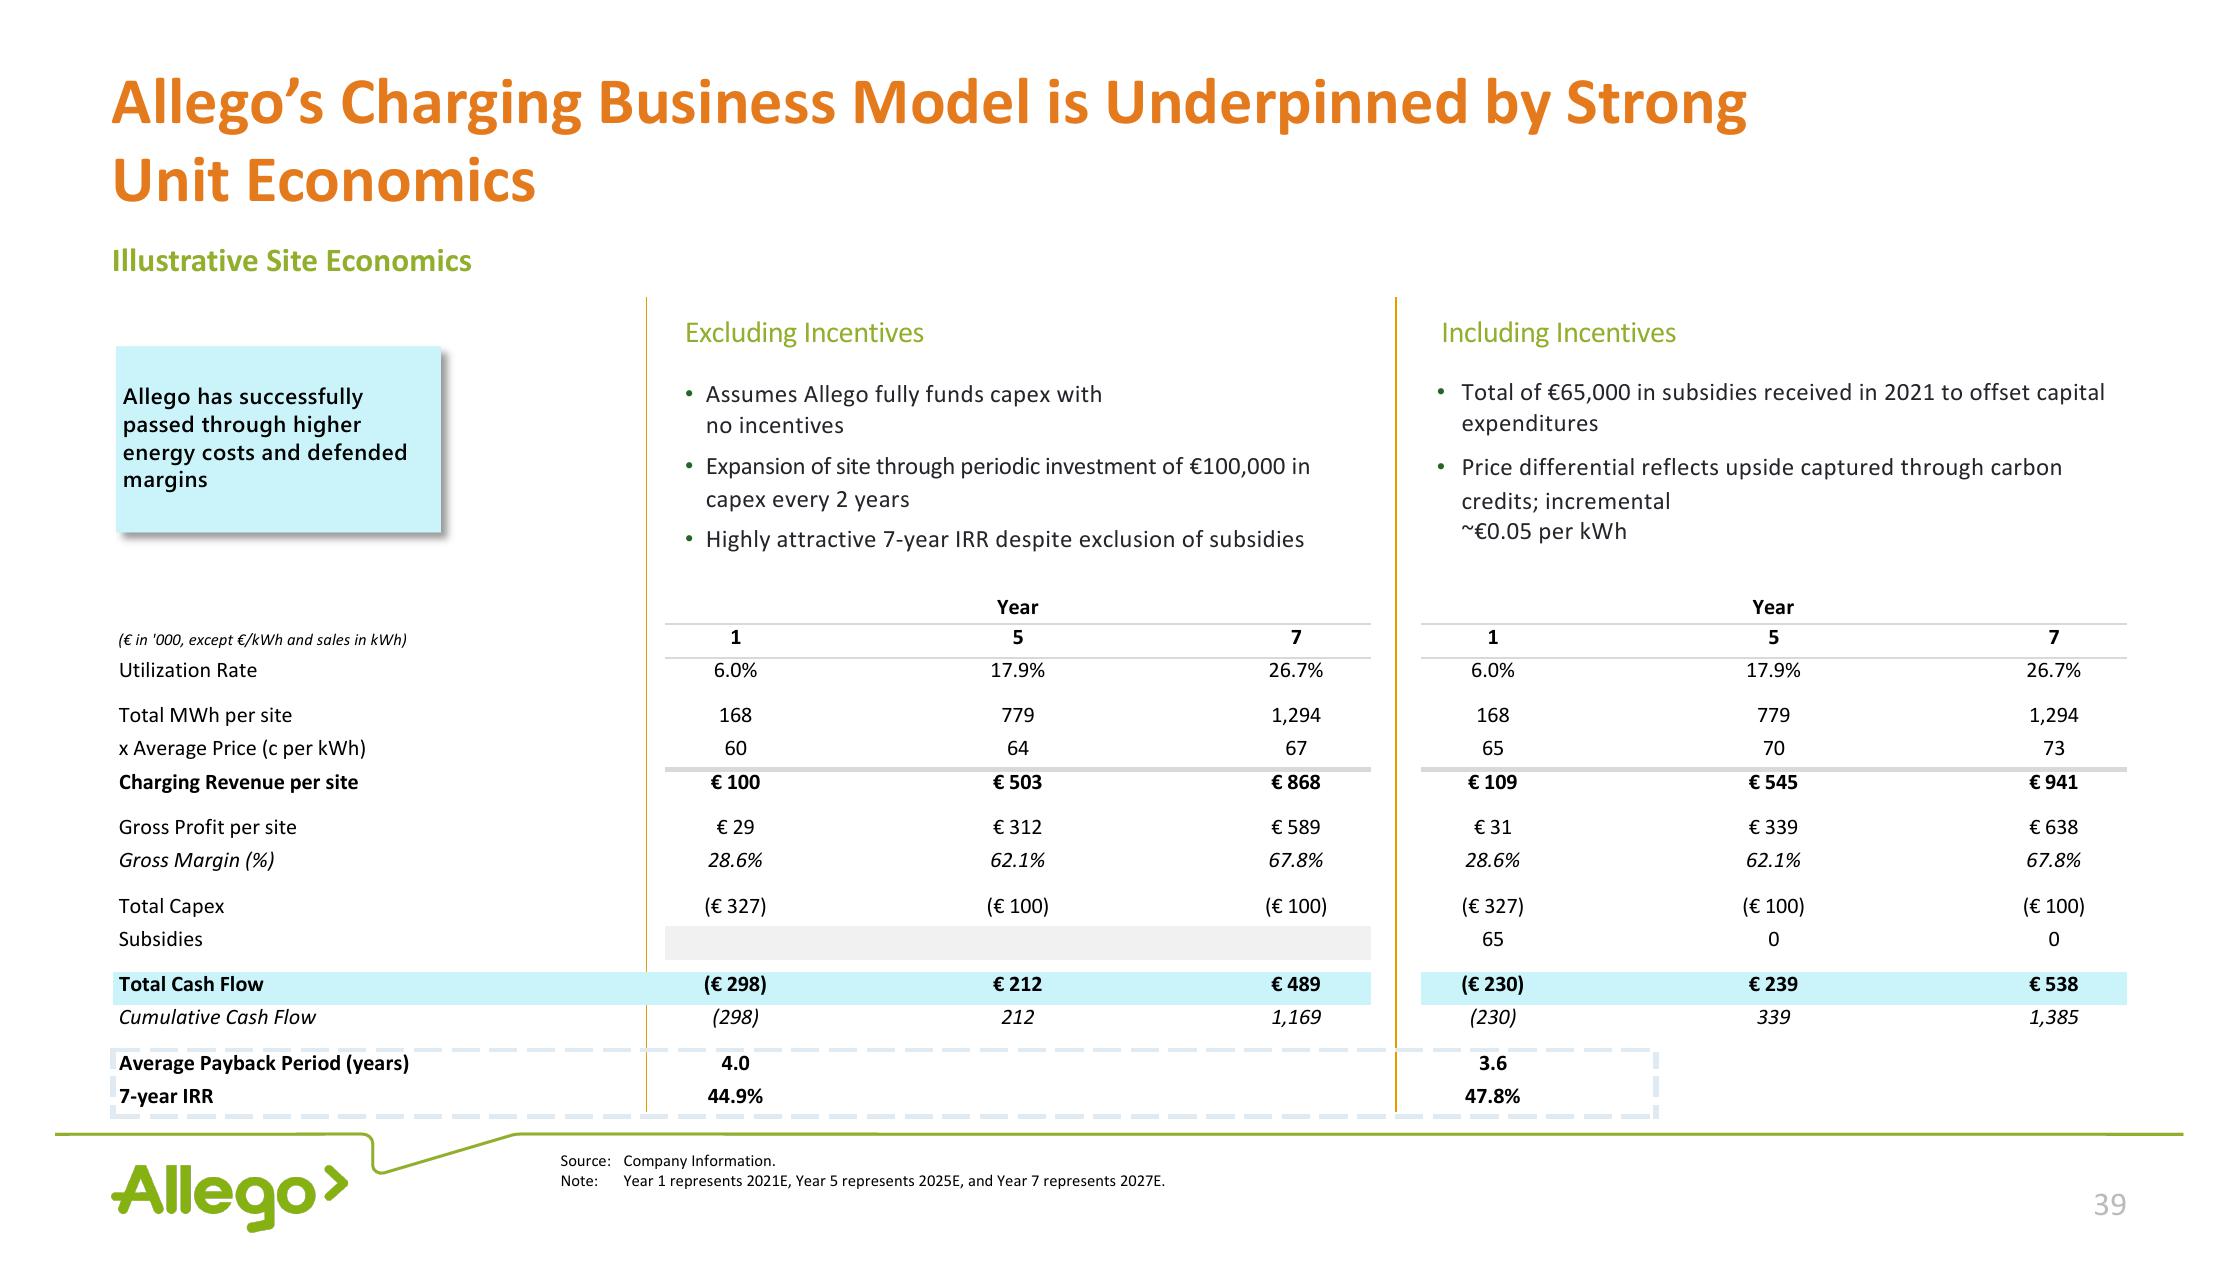
Allego's Charging Business Model is Underpinned by Strong
Unit Economics
Illustrative Site Economics
Allego has successfully
passed through higher
energy costs and defended
margins
(€ in '000, except €/kWh and sales in kWh)
Utilization Rate
Total MWh per site
x Average Price (c per kWh)
Charging Revenue per site
Gross Profit per site
Gross Margin (%)
Total Capex
Subsidies
Total Cash Flow
Cumulative Cash Flow
Average Payback Period (years)
7-year IRR
Allego>
Excluding Incentives
• Assumes Allego fully funds capex with
no incentives
●
●
Expansion of site through periodic investment of €100,000 in
capex every 2 years
Highly attractive 7-year IRR despite exclusion of subsidies
1
6.0%
168
60
€ 100
€ 29
28.6%
(€ 327)
(€ 298)
(298)
4.0
44.9%
Year
5
17.9%
779
64
€ 503
€ 312
62.1%
(€ 100)
€ 212
212
Source: Company Information.
Note: Year 1 represents 2021E, Year 5 represents 2025E, and Year 7 represents 2027E.
7
26.7%
1,294
67
€ 868
€ 589
67.8%
(€ 100)
€ 489
1,169
Including Incentives
• Total of €65,000 in subsidies received in 2021 to offset capital
expenditures
●
Price differential reflects upside captured through carbon
credits; incremental
~€0.05 per kWh
1
6.0%
168
65
€ 109
€ 31
28.6%
(€ 327)
65
(€ 230)
(230)
3.6
47.8%
Year
5
17.9%
779
70
€ 545
€ 339
62.1%
(€ 100)
0
€ 239
339
7
26.7%
1,294
73
€ 941
€ 638
67.8%
(€ 100)
0
€ 538
1,385
39View entire presentation