J.P.Morgan Results Presentation Deck
Consumer & Community Banking ¹
SELECTED INCOME STATEMENT DATA ($MM)
Revenue
Banking & Wealth Management²
Home Lending
Card Services & Auto
Expense²
Credit costs
Net charge-offs (NCOs)
Change in allowance
Net income
Average equity
ROE
Reported
$18,097
10,877
1,161
6,059
9,336
2,189
1,638
551
$4,788
Overhead ratio
Average loans
Average deposits
Active mobile customers (mm)4
Debit & credit card sales volume 5
KEY DRIVERS / STATISTICS ($B)³
4Q23
Reported
$55.5
33%
52
$571.2
1,092.4
53.8
$441.0
4Q23
FR impact
$1,091
745
346
Note: Totals may not sum due to rounding
1 See note 1 on slide 13; 2 See note 3 on slide 14
For additional footnotes see slide 15
599
15
2
13
$362
JPMORGAN CHASE & CO.
FR impact
$3.5
0%
0
$94.5
42.9
n.a.
$0.5
ex. FR
$17,006
10,132
814
6,059
8,737
2,174
1,636
538
$4,425
ex. FR
$52.0
33%
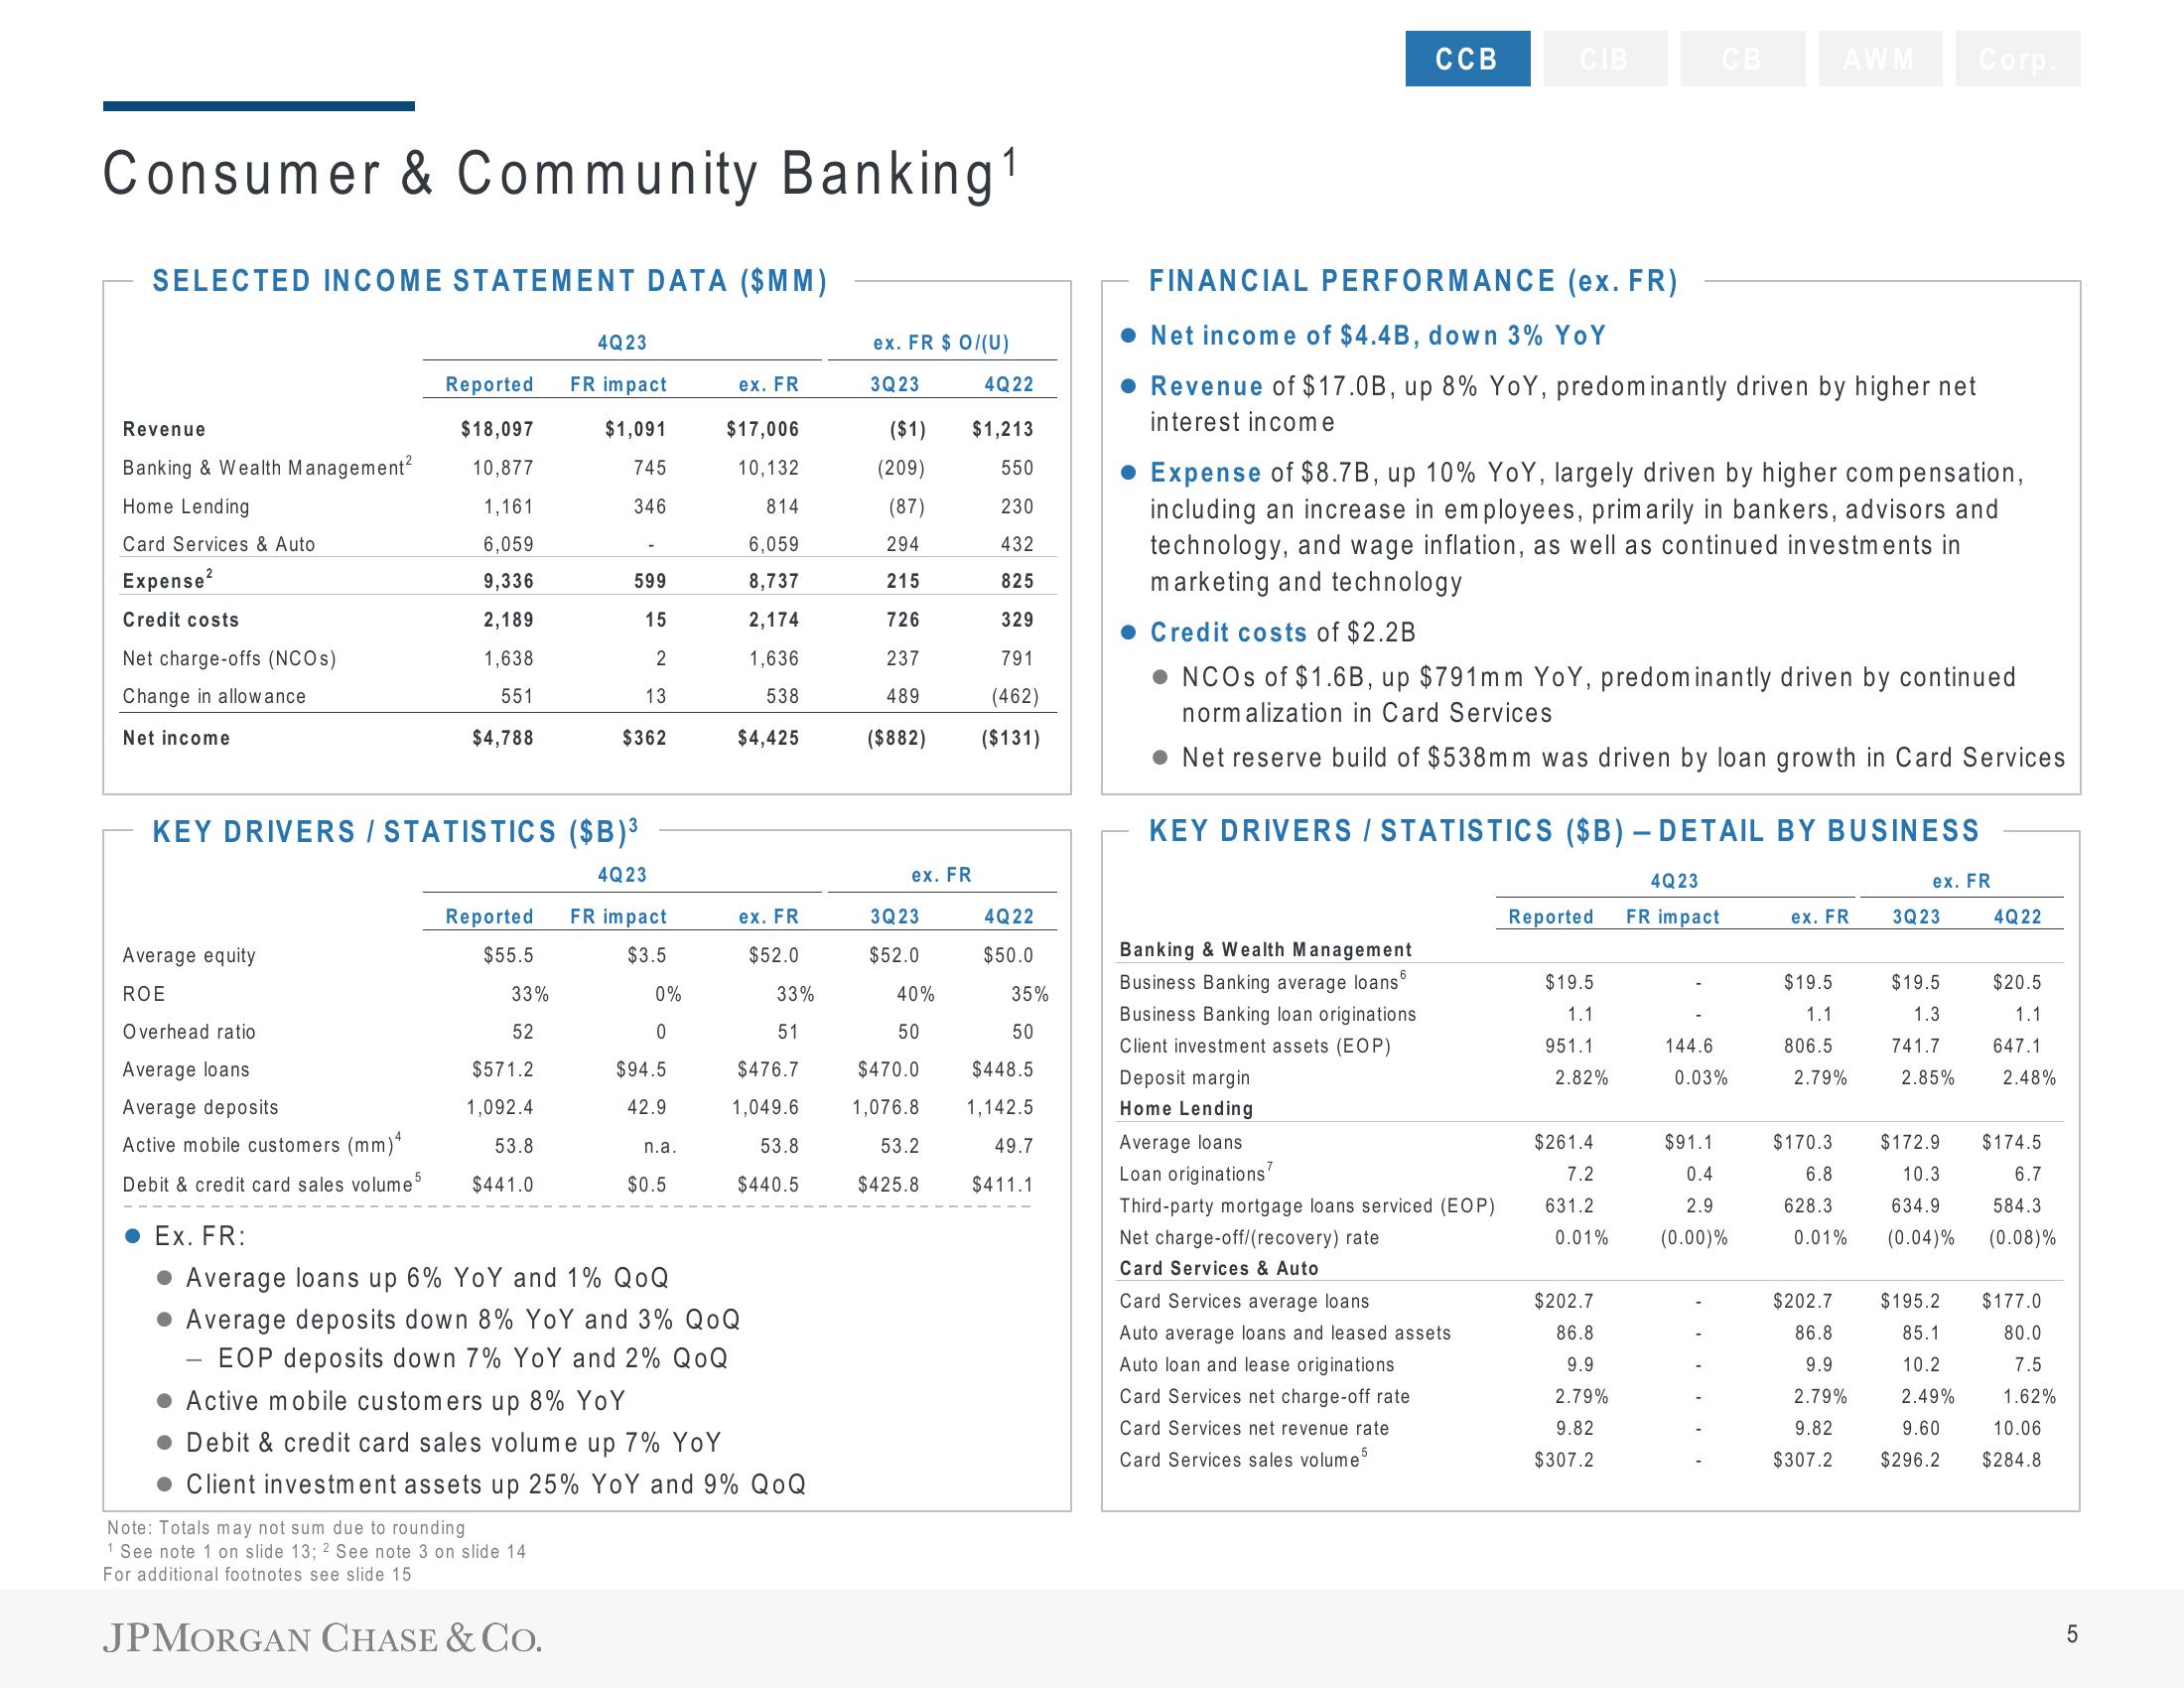
Ex. FR:
Average loans up 6% YoY nd 1% QOQ
Average deposits down 8% YoY and 3% QOQ
-EOP deposits down 7% YoY and 2% QOQ
Active mobile customers up 8% YoY
Debit & credit card sales volume up 7% YoY
Client investment assets up 25% YoY and 9% QOQ
51
$476.7
1,049.6
53.8
$440.5
ex. FR $ 0/(U)
3Q23
($1)
(209)
(87)
4Q22
$1,213
550
230
294
432
215
825
726
329
237
791
489
(462)
($882) ($131)
ex. FR
3Q23
$52.0
40%
50
4Q22
$50.0
35%
50
$470.0 $448.5
1,076.8 1,142.5
53.2
49.7
$411.1
$425.8
CCB
CIB
FINANCIAL PERFORMANCE (ex. FR)
Net income of $4.4B, down 3% YoY
• Revenue of $17.0B, up 8% YoY, predominantly driven by higher net
interest income
Banking & Wealth Management
Business Banking average loans
Business Banking loan originations
Client investment assets (EOP)
Deposit margin
Home Lending
Average loans
Loan originations
Expense of $8.7B, up 10% YoY, largely driven by higher compensation,
including an increase in employees, primarily in bankers, advisors and
technology, and wage inflation, as well as continued investments in
marketing and technology
Credit costs of $2.2B
NCOs of $1.6B, up $791mm YoY, predominantly driven by continued
normalization in Card Services
Net reserve build of $538mm was driven by loan growth in Card Services
Third-party mortgage loans serviced (EOP)
Net charge-off/(recovery) rate
Card Services & Auto
Card Services average loans
Auto average loans and leased assets
Auto loan and lease originations
Card Services net charge-off rate
Card Services net revenue rate
Card Services sales volume 5
KEY DRIVERS / STATISTICS ($B)- DETAIL BY BUSINESS
4Q23
FR impact
Reported
$19.5
1.1
951.1
2.82%
CB
$261.4
7.2
631.2
0.01%
$202.7
86.8
9.9
2.79%
AWM Corp.
9.82
$307.2
144.6
0.03%
$91.1
0.4
2.9
(0.00)%
ex. FR
$19.5
1.1
806.5
2.79%
$170.3
6.8
628.3
0.01%
$202.7
86.8
9.9
2.79%
9.82
$307.2
ex. FR
3Q23
$19.5
1.3
741.7
2.85%
4Q22
$20.5
1.1
647.1
2.48%
$172.9 $174.5
10.3
634.9
(0.04)%
6.7
584.3
(0.08)%
$195.2 $177.0
85.1
80.0
10.2
7.5
2.49%
1.62%
9.60 10.06
$296.2 $284.8
LO
5View entire presentation