Sonos Results Presentation Deck
Responsibly Investing to Drive Long Term Growth
Y/Y Change
18%
16%
(33)%
N/A
16%
R&D (GAAP)
Less: Stock-based compensation expense
Less: Amortization of intangibles
Less: Restructuring and abandonment costs
R&D (Non-GAAP)
% of revenue
S&M (GAAP)
Less: Stock-based compensation expense
Less: Amortization of intangibles
Less: Restructuring and abandonment costs
S&M (Non-GAAP)
% of revenue
G&A (GAAP)
Less: Stock-based compensation expense
Less: Legal and transaction related costs
Less: Amortization of intangibles
Less: Restructuring and abandonment costs
Adjusted G&A (Non-GAAP)
% of revenue
Total Operating Expenses (GAAP)
% of revenue
Less: Stock-based compensation expense
Less: Legal and transaction related costs
Less: Amortization of intangibles
Less: Restructuring and abandonment costs
Adjusted Operating Expenses (Non-GAAP)
% of revenue
FY23
$ 301.0
35.5
2.0
6.6
$256.9
15.5%
$267.5
15.7
5.6
$ 246.2
14.9%
$168.5
23.6
33.0
0.1
3.5
$108.4
6.5%
$ 737.0
44.5%
74.8
33.0
2.1
15.6
$ 611.5
36.9%
FY22
$256.1
30.7
3.0
$ 222.4
12.7%
$280.3
15.3
$ 265.0
15.1%
$ 170.4
28.0
22.9
0.1
$ 119.5
6.8%
$ 706.8
40.3%
74.0
22.9
3.1
$606.9
34.6%
280 bps
(5)%
2%
N/A
N/A
(7)%
-20 bps
(1)%
(16)%
44%
N/A
(9)%
-30 bps
4%
420 bps
1%
44%
(32)%
N/A
1%
230 bps
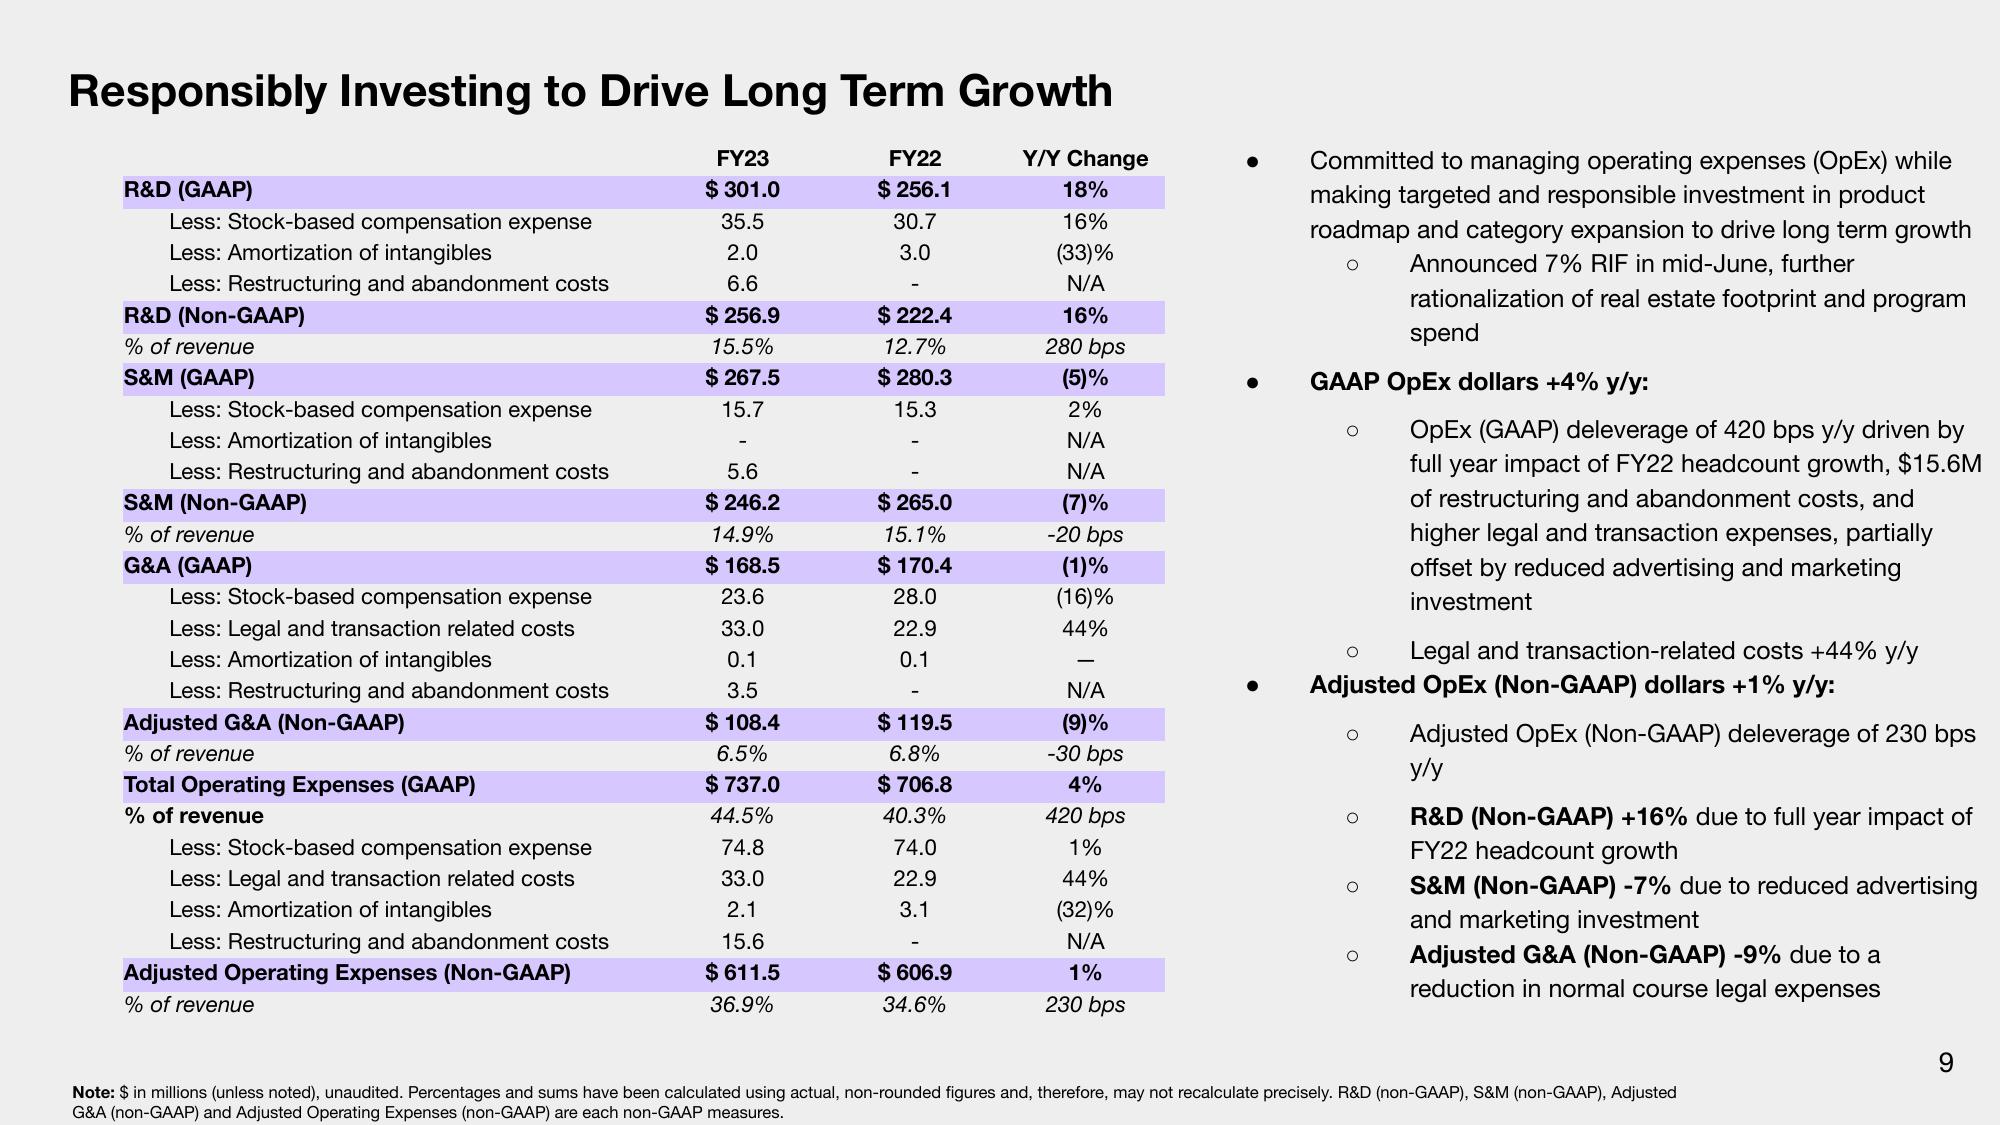
Committed to managing operating expenses (OpEx) while
making targeted and responsible investment in product
roadmap and category expansion to drive long term growth
Announced 7% RIF in mid-June, further
O
rationalization of real estate footprint and program
spend
GAAP OpEx dollars +4% y/y:
O
O
Legal and transaction-related costs +44% y/y
Adjusted OpEx (Non-GAAP) dollars +1% y/y:
Adjusted OpEx (Non-GAAP) deleverage of 230 bps
y/y
R&D (Non-GAAP) +16% due to full year impact of
FY22 headcount growth
O
O
O
OpEx (GAAP) deleverage of 420 bps y/y driven by
full year impact of FY22 headcount growth, $15.6M
of restructuring and abandonment costs, and
higher legal and transaction expenses, partially
offset by reduced advertising and marketing
investment
O
S&M (Non-GAAP) -7% due to reduced advertising
and marketing investment
Adjusted G&A (Non-GAAP) -9% due to a
reduction in normal course legal expenses
Note: $ in millions (unless noted), unaudited. Percentages and sums have been calculated using actual, non-rounded figures and, therefore, may not recalculate precisely. R&D (non-GAAP), S&M (non-GAAP), Adjusted
G&A (non-GAAP) and Adjusted Operating Expenses (non-GAAP) are each non-GAAP measures.
9View entire presentation