Houlihan Lokey Investor Presentation Deck
Reconciliation
of GAAP to
Adjusted Financials
(In thousands, except per share data)
Revenues
Employee compensation and benefits expenses
Employee compensation and benefits expenses (GAAP)
Less: Acquisition related retention payments
Employee compensation and benefits expenses (adjusted)
Non-compensation expenses
Non-compensation expenses (GAAP)
Less: Integration and acquisition related costs
Less: Acquisition amortization
Non-compensation expenses (adjusted)
Operating income
Operating income (GAAP)
Plus: Adjustments (1)
Operating income (adjusted)
Other (income)/expense, net
Other (income)/expense, net (GAAP)
Less: Warrant revaluation
Plus/(less): Change in acquisition earnout liability fair value
Other (income)/expense, net (adjusted)
Provision for income taxes
Provision for income taxes (GAAP)
Plus: Impact of the excess tax benefit for stock vesting
Plus: Release of the provision for an uncertain tax position as a result
of the successful closure of a state audit
Adjusted provision for income taxes
Plus: Resulting tax impact (2)
Provision for income taxes (adjusted)
Net income
Net income (GAAP)
Plus: Adjustments (3)
Net income (adjusted)
Fully diluted shares outstanding
Fully diluted shares outstanding (GAAP)
Plus: Impact of unvested GCA retention and deferred share awards
Fully diluted shares outstanding (adjusted)
Diluted EPS attributable to Houlihan Lokey, Inc, (GAAP)
Diluted EPS attributable to Houlihan Lokey, Inc, (adjusted)
$
$
$
$
$
$
$
$
Three Months Ended September 30,
2023
466,989
296,542 $
(9,342)
287,200
80,170
(1,465)
(3,360)
75,345
90,277 $
14,167
104,444
(3,296)
816
(2,480)
26,542
26,542
3,787
30,329
$
67,031
9,564
76,595
67,867,381
1,132,423
68,999,804
$
$
0.99 $
1.11 $
2022
489,537
309,859
(8,796)
301,063
90,307
(2,325)
(15,624)
72,358
89,371
26,745
116,116
5,104
(1,014)
(2,841)
1,249
23,537
23,537
8,547
32,084
60,730
22,053
82,783
69,800,028
69,800,028
0.87
1.19
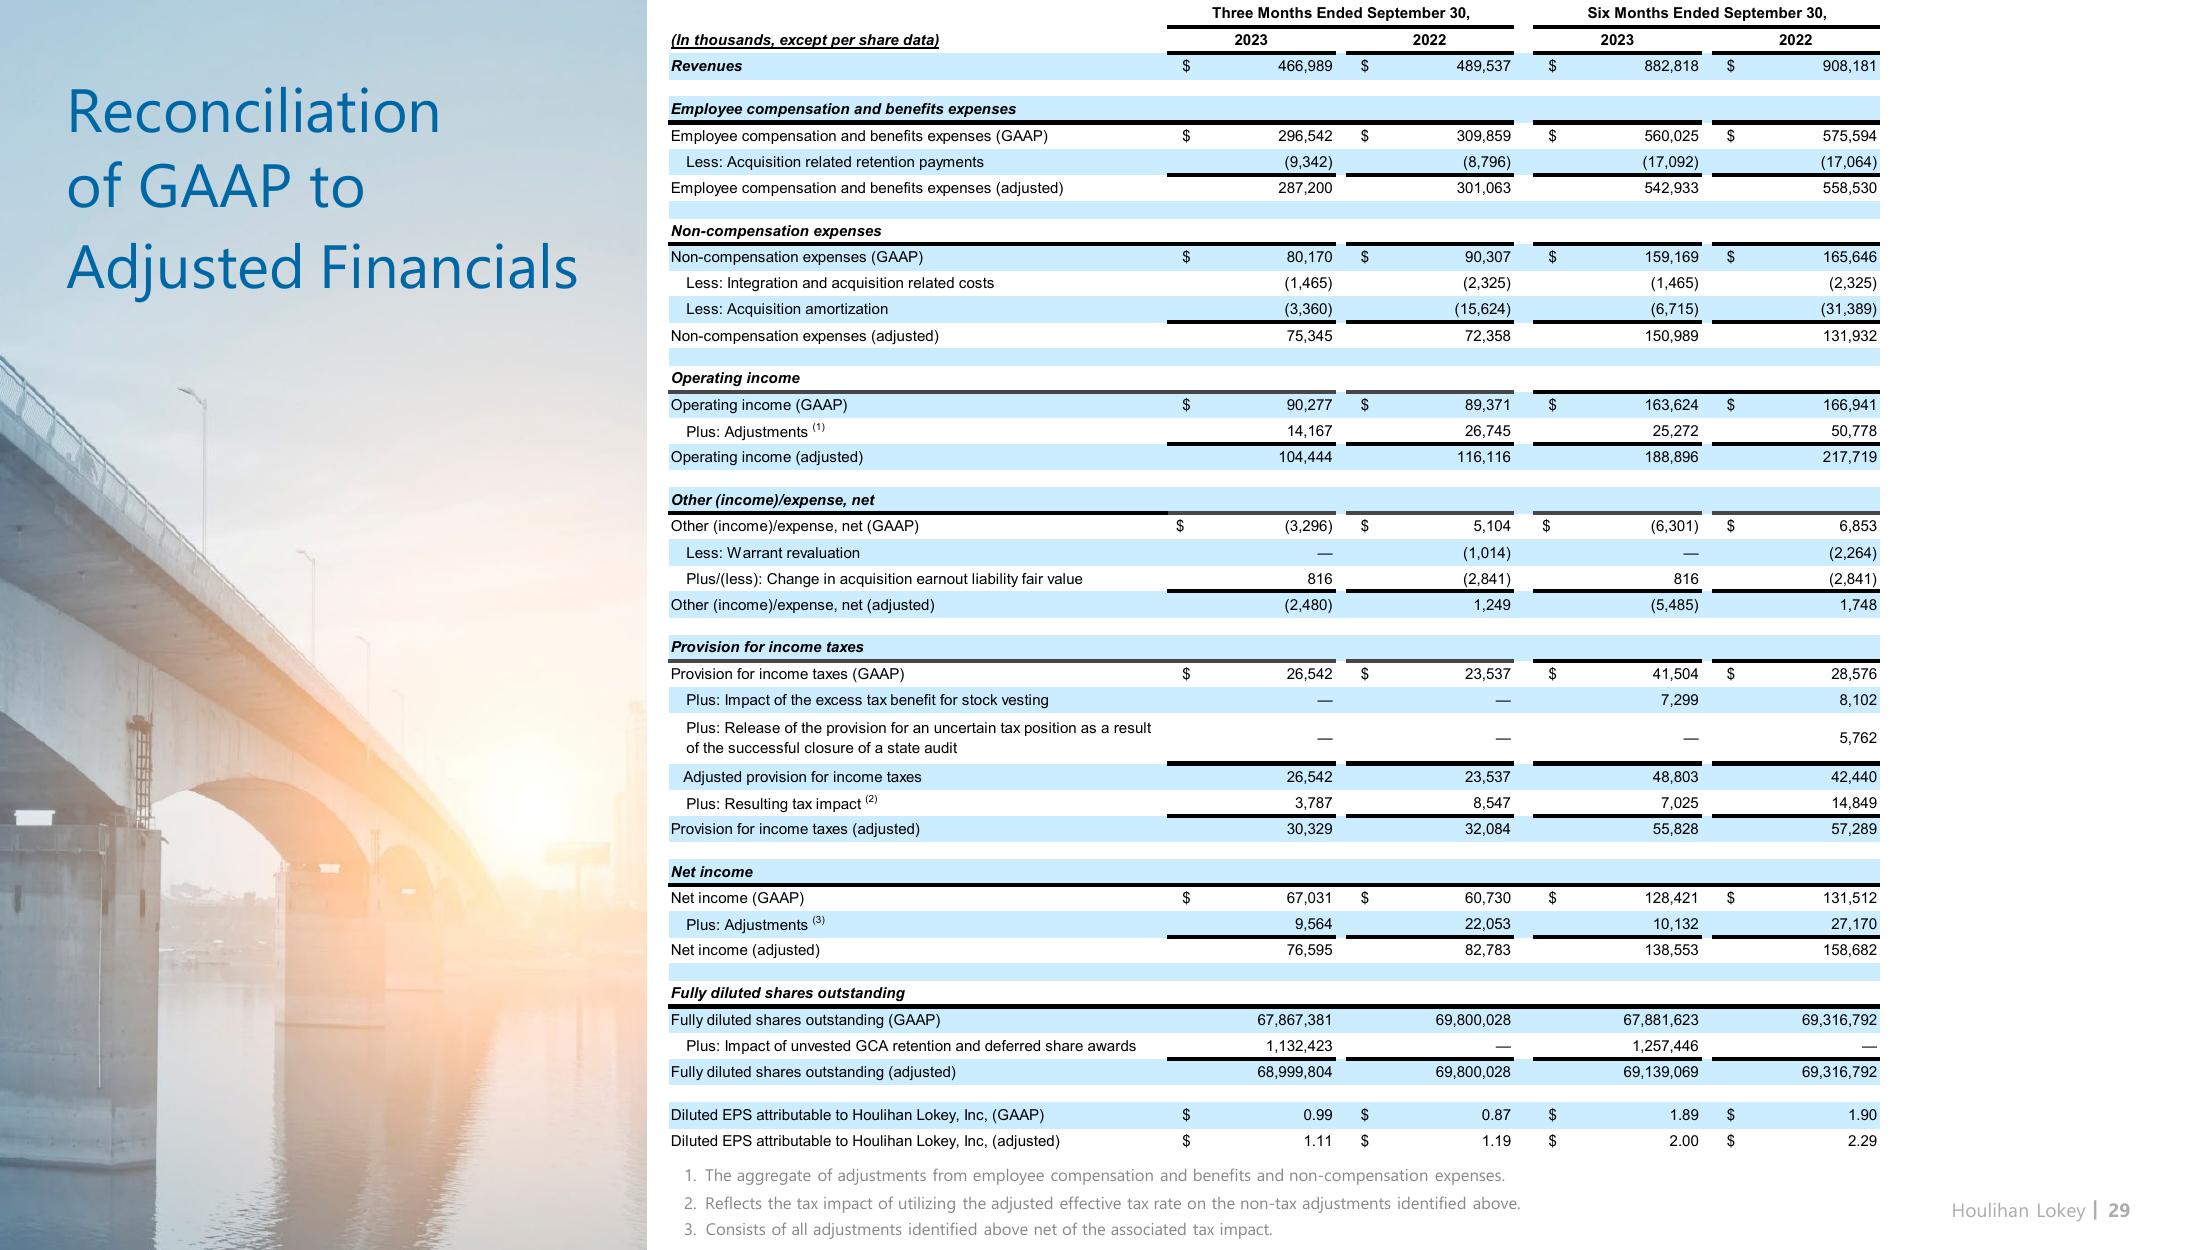
1. The aggregate of adjustments from employee compensation and benefits and non-compensation expenses.
2. Reflects the tax impact of utilizing the adjusted effective tax rate on the non-tax adjustments identified above.
3. Consists of all adjustments identified above net of the associated tax impact.
$
$
$
$
$
$
$
$
$
Six Months Ended September 30,
2023
2022
882,818 $
560,025
(17,092)
542,933
159, 169
(1,465)
(6,715)
150,989
163,624
25,272
188,896
(6,301)
816
(5,485)
41,504
7,299
48,803
7,025
55,828
128,421
10,132
138,553
67,881,623
1,257,446
69,139,069
1.89
2.00
$
$
$
$
$
$
$
$
908,181
575,594
(17,064)
558,530
165,646
(2,325)
(31,389)
131,932
166,941
50,778
217,719
6,853
(2,264)
(2,841)
1,748
28,576
8,102
5,762
42,440
14,849
57,289
131,512
27,170
158,682
69,316,792
69,316,792
1.90
2.29
Houlihan Lokey | 29View entire presentation