Wix Results Presentation Deck
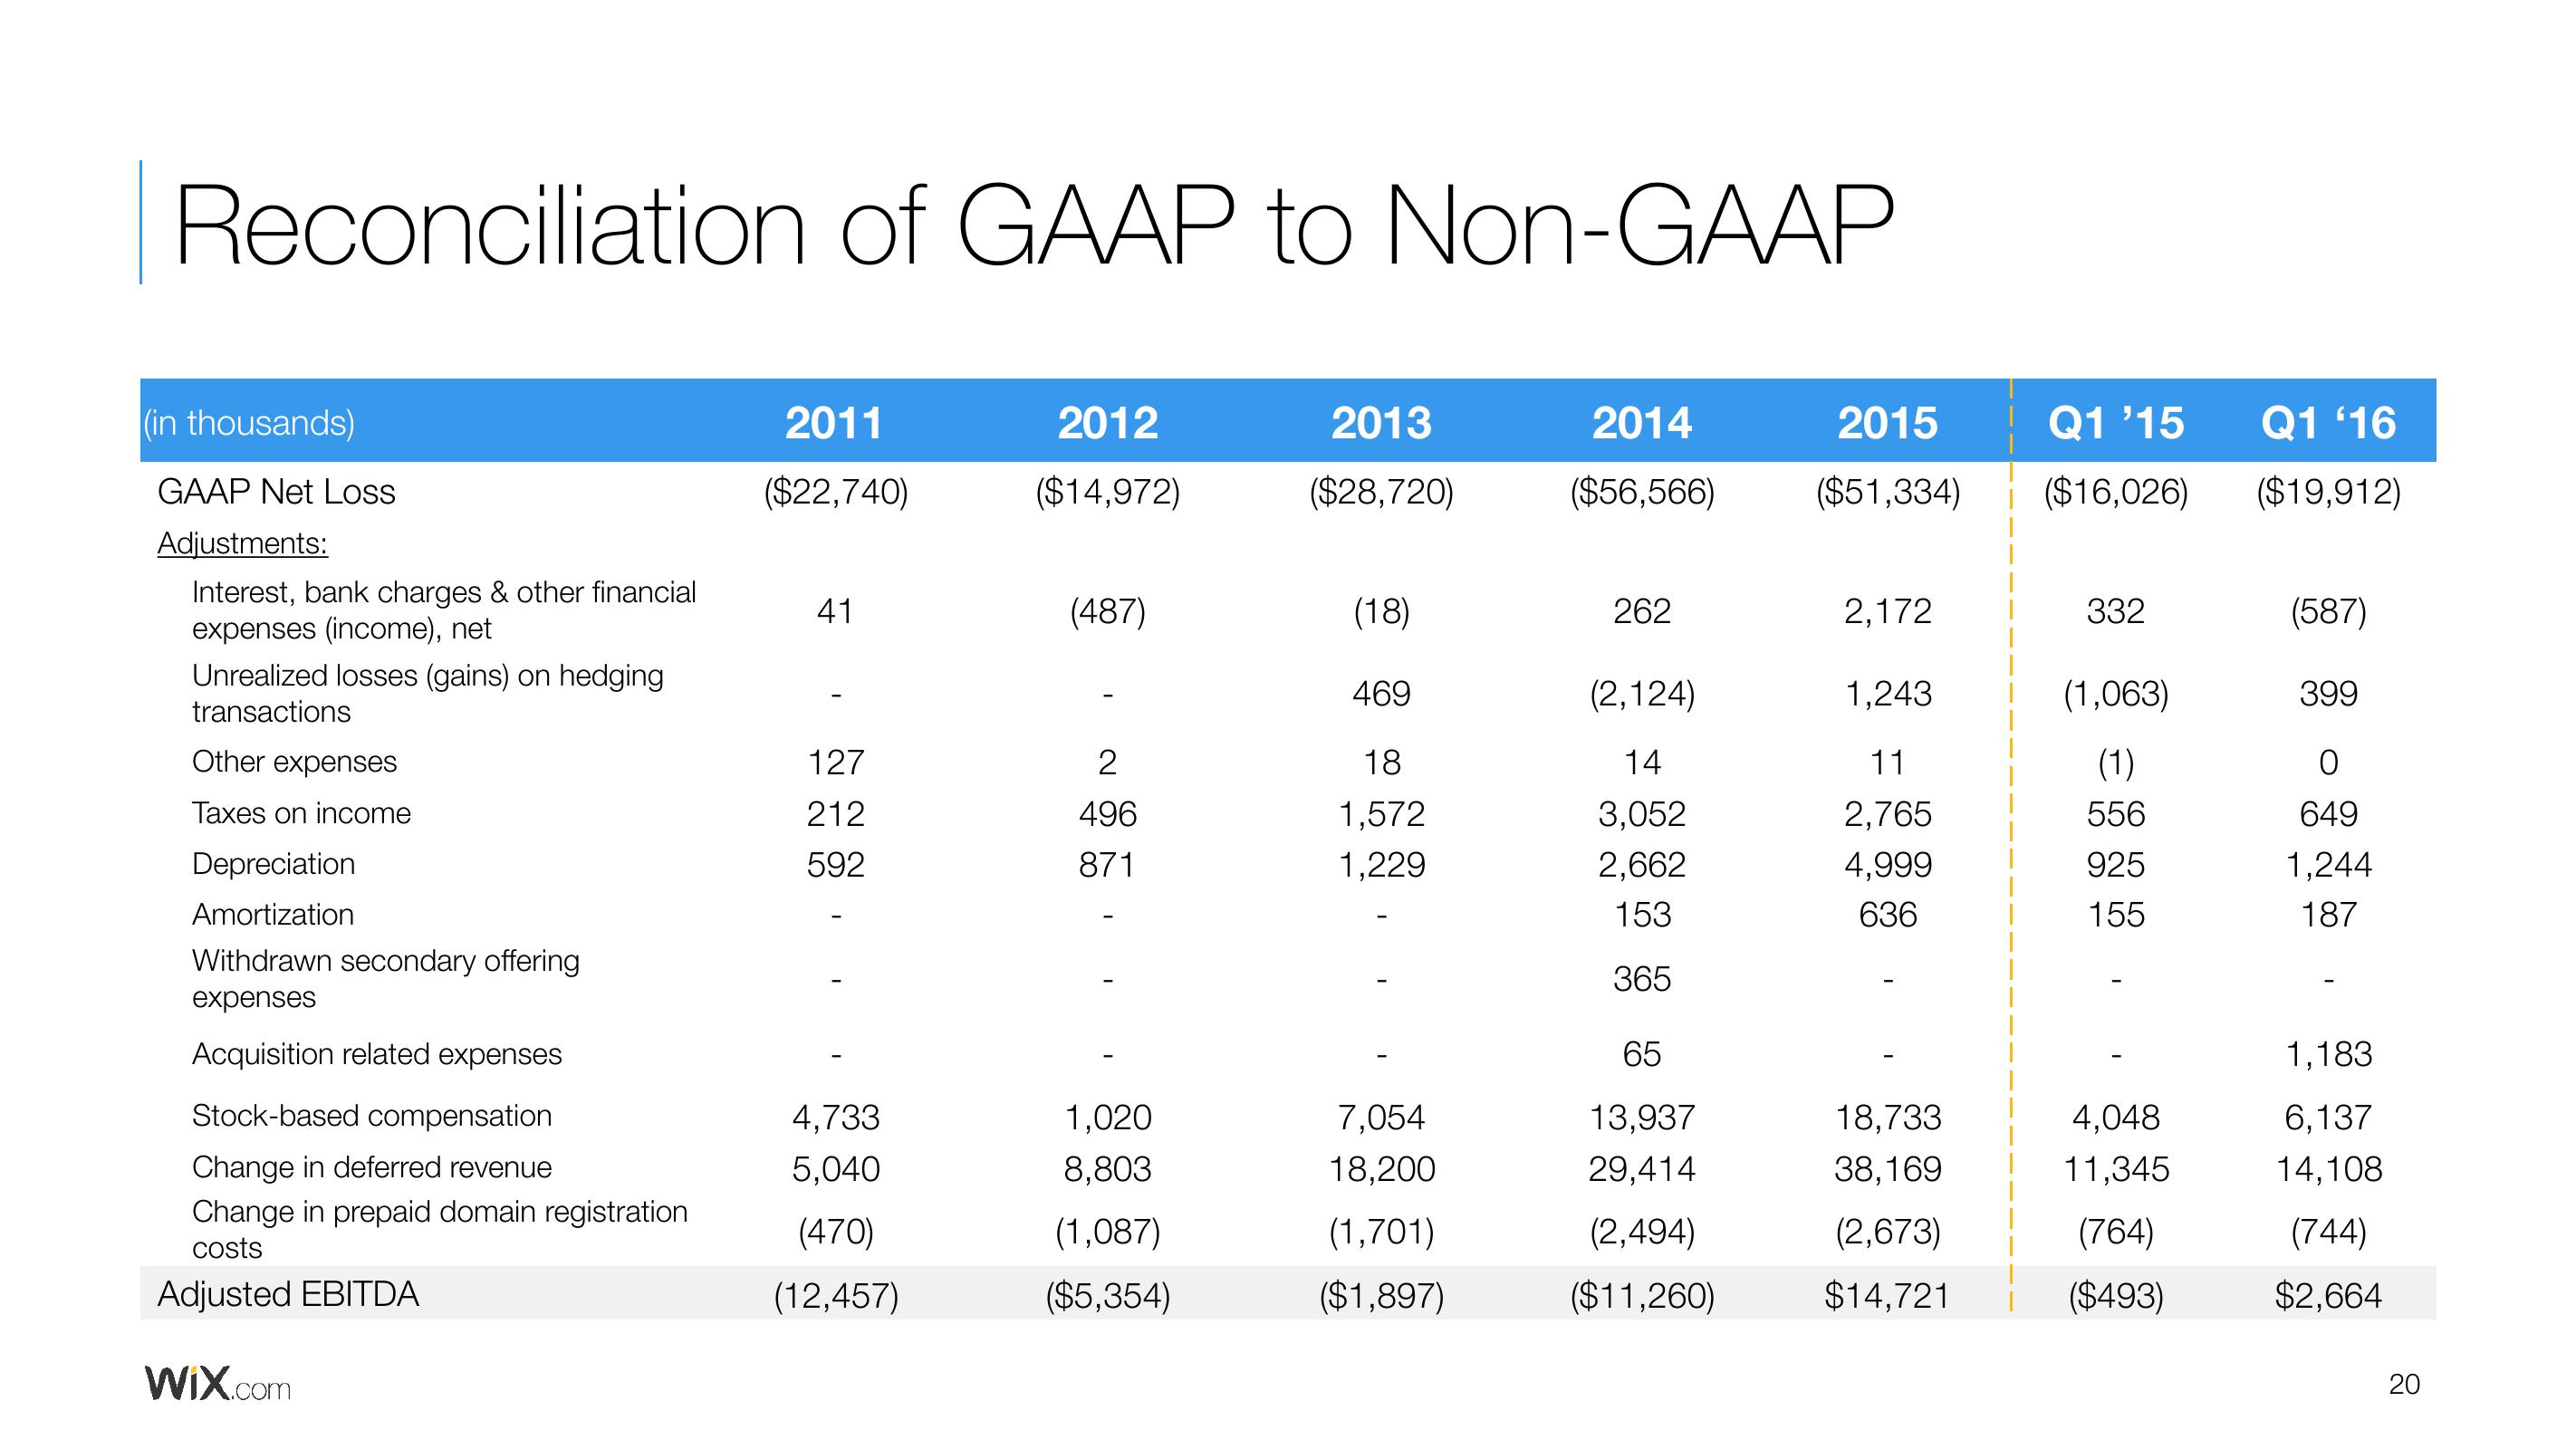
Reconciliation of GAAP to Non-GAAP
(in thousands)
GAAP Net Loss
Adjustments:
Interest, bank charges & other financial
expenses (income), net
Unrealized losses (gains) on hedging
transactions
Other expenses
Taxes on income
Depreciation
Amortization
Withdrawn secondary offering
expenses
Acquisition related expenses
Stock-based compensation
Change in deferred revenue
Change in prepaid domain registration
costs
Adjusted EBITDA
Wix.com
2011
($22,740)
41
127
212
592
4,733
5,040
(470)
(12,457)
2012
($14,972)
(487)
2
496
871
1,020
8,803
(1,087)
($5,354)
2013
($28,720)
(18)
469
18
1,572
1,229
7,054
18,200
(1,701)
($1,897)
2014
($56,566)
262
(2,124)
14
3,052
2,662
153
365
65
13,937
29,414
(2,494)
($11,260)
2015
($51,334)
2,172
1,243
11
2,765
4,999
636
18,733
38,169
(2,673)
$14,721
Q1 '15
($16,026)
332
(1,063)
(1)
556
925
155
4,048
11,345
(764)
($493)
Q1 '16
($19,912)
(587)
399
O
649
1,244
187
1,183
6,137
14,108
(744)
$2,664
20View entire presentation