Jefferies Financial Group Investor Day Presentation Deck
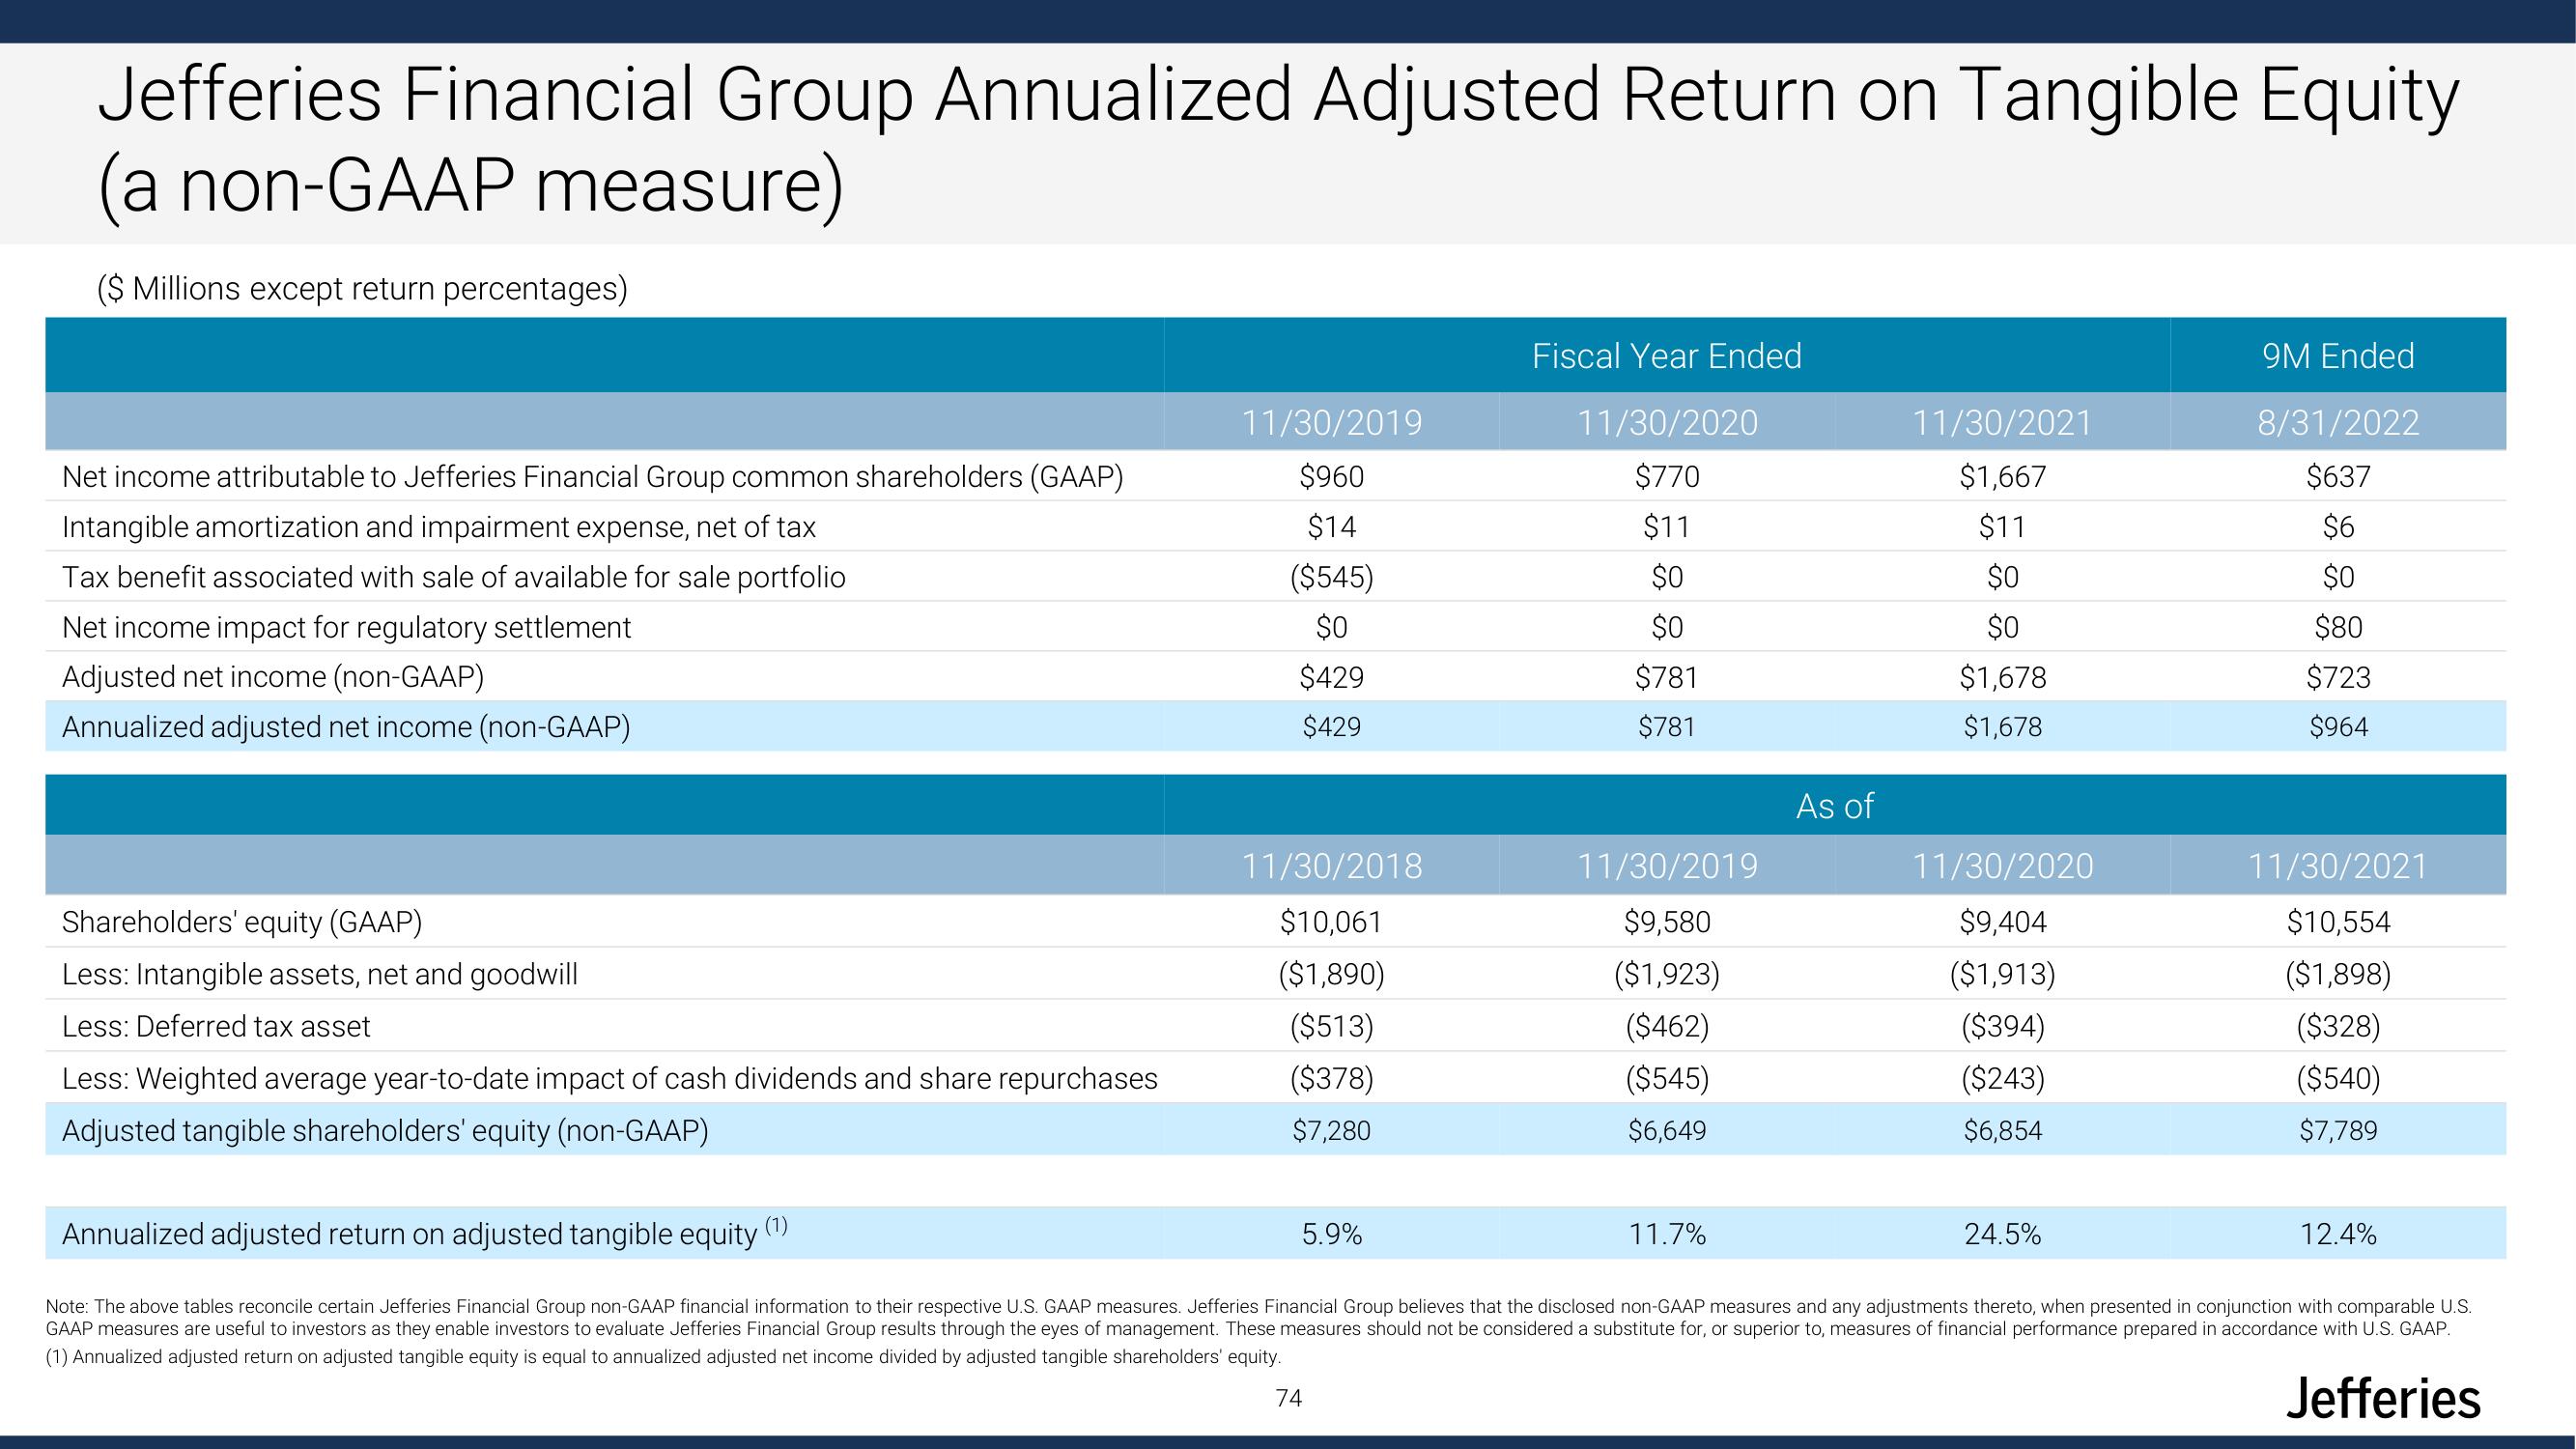
Jefferies Financial Group Annualized Adjusted Return on Tangible Equity
(a non-GAAP measure)
($ Millions except return percentages)
Net income attributable to Jefferies Financial Group common shareholders (GAAP)
Intangible amortization and impairment expense, net of tax
Tax benefit associated with sale of available for sale portfolio
Net income impact for regulatory settlement
Adjusted net income (non-GAAP)
Annualized adjusted net income (non-GAAP)
Shareholders' equity (GAAP)
Less: Intangible assets, net and goodwill
Less: Deferred tax asset
Less: Weighted average year-to-date impact of cash dividends and share repurchases
Adjusted tangible shareholders' equity (non-GAAP)
Annualized adjusted return on adjusted tangible equity
(1)
11/30/2019
$960
$14
($545)
$0
$429
$429
11/30/2018
$10,061
($1,890)
($513)
($378)
$7,280
5.9%
Fiscal Year Ended
11/30/2020
$770
$11
$0
$0
$781
$781
74
11/30/2019
$9,580
($1,923)
($462)
($545)
$6,649
11.7%
As of
11/30/2021
$1,667
$11
$0
$0
$1,678
$1,678
11/30/2020
$9,404
($1,913)
($394)
($243)
$6,854
24.5%
9M Ended
8/31/2022
$637
$6
$0
$80
$723
$964
11/30/2021
$10,554
($1,898)
($328)
($540)
$7,789
12.4%
Note: The above tables reconcile certain Jefferies Financial Group non-GAAP financial information to their respective U.S. GAAP measures. Jefferies Financial Group believes that the disclosed non-GAAP measures and any adjustments thereto, when presented in conjunction with comparable U.S.
GAAP measures are useful to investors as they enable investors to evaluate Jefferies Financial Group results through the eyes of management. These measures should not be considered a substitute for, or superior to, measures of financial performance prepared in accordance with U.S. GAAP.
(1) Annualized adjusted return on adjusted tangible equity is equal to annualized adjusted net income divided by adjusted tangible shareholders' equity.
JefferiesView entire presentation