Apollo Global Management Investor Presentation Deck
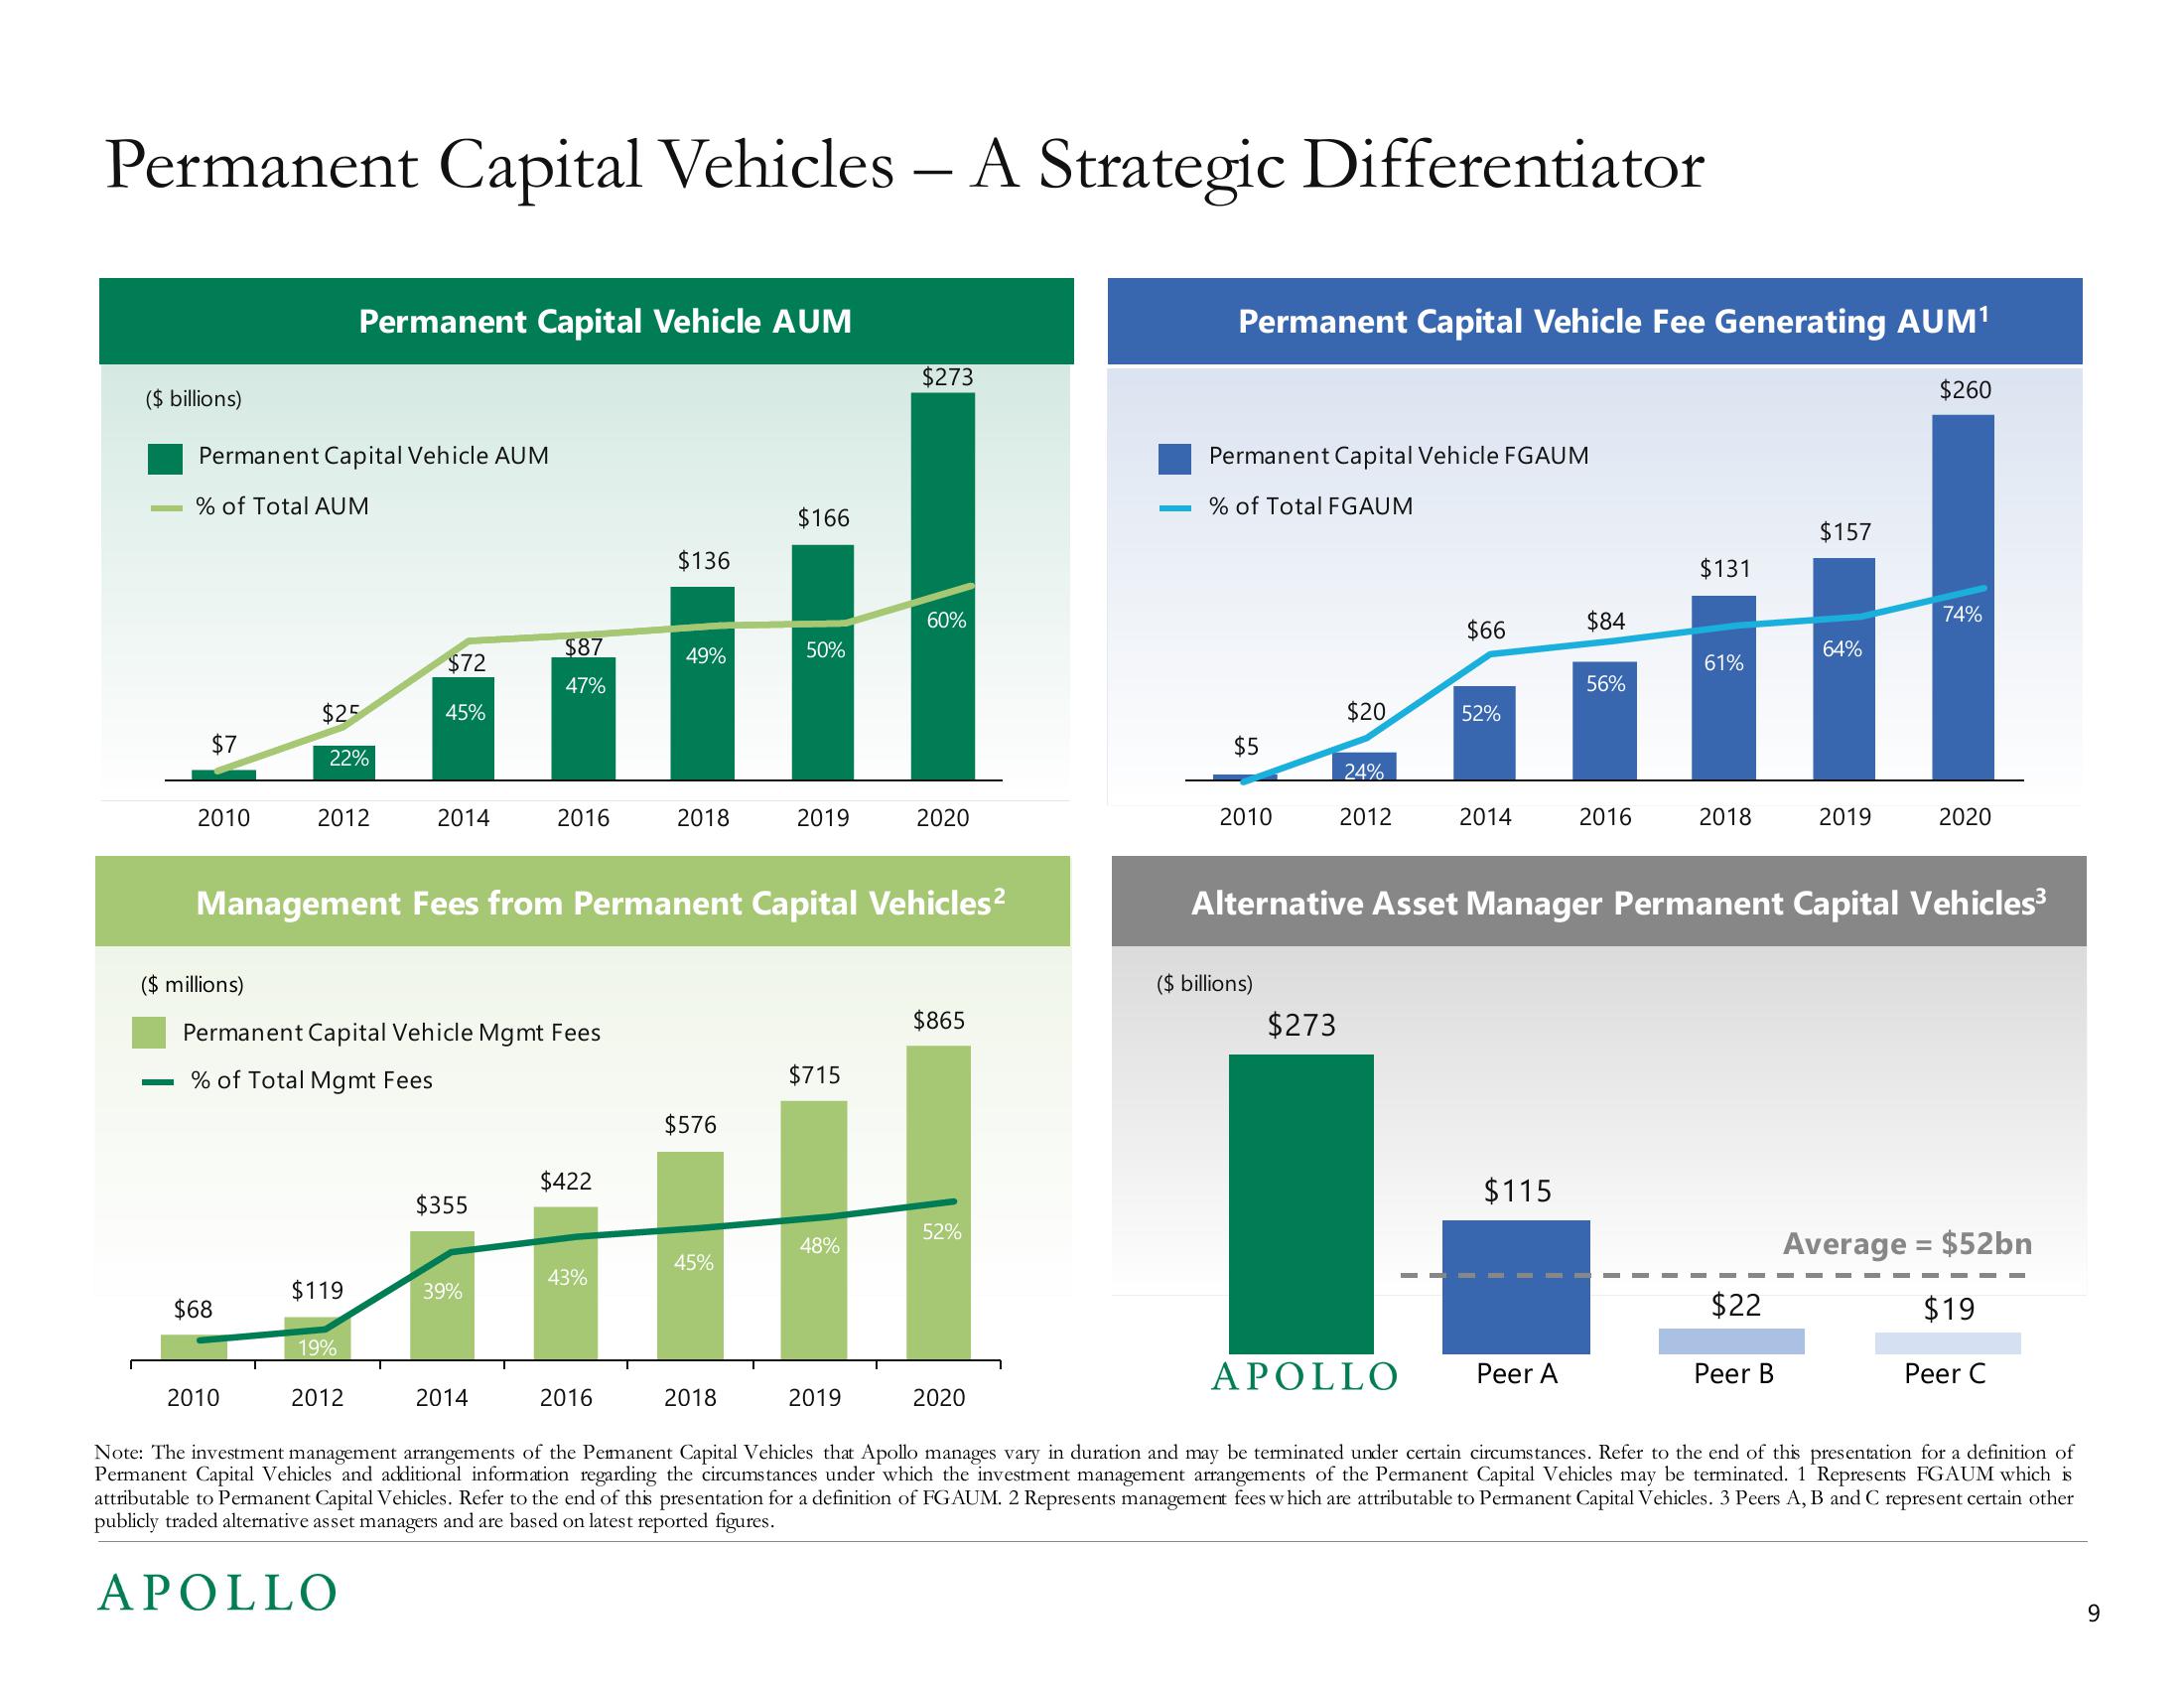
Permanent Capital Vehicles - A Strategic Differentiator
($ billions)
Permanent Capital Vehicle AUM
% of Total AUM
$7
2010
($ millions)
$68
$25
Permanent Capital Vehicle AUM
22%
2010
2012
$119
19%
$72
45%
Permanent Capital Vehicle Mgmt Fees
% of Total Mgmt Fees
2012
2014
$355
$87
47%
39%
2016
Management Fees from Permanent Capital Vehicles²
2014
$422
43%
$136
I
2016
49%
2018
$576
45%
$166
50%
2018
2019
$715
48%
$273
60%
2019
2020
$865
52%
Permanent Capital Vehicle Fee Generating AUM¹
2020
Permanent Capital Vehicle FGAUM
% of Total FGAUM
$5
2010
($ billions)
$20
24%
2012
$273
$66
52%
2014
$115
$84
Peer A
56%
2016
$131
61%
2018
$22
$157
Alternative Asset Manager Permanent Capital Vehicles³
Peer B
64%
2019
APOLLO
Note: The investment management arrangements of the Permanent Capital Vehicles that Apollo manages vary in duration and may be terminated under certain circumstances. Refer to the end of this presentation for a definition of
Permanent Capital Vehicles and additional information regarding the circumstances under which the investment management arrangements of the Permanent Capital Vehicles may be terminated. 1 Represents FGAUM which is
attributable to Permanent Capital Vehicles. Refer to the end of this presentation for a definition of FGAUM. 2 Represents management fees which are attributable to Permanent Capital Vehicles. 3 Peers A, B and C represent certain other
publicly traded alternative asset managers and are based on latest reported figures.
APOLLO
$260
74%
2020
Average = $52bn
$19
Peer C
9View entire presentation