Commercial Metals Company Results Presentation Deck
Leverage Profile
Net Debt¹,2 / EBITDA³
4.5x
4.0x
3.5x
3.0x
2.5x
2.0x
1.5x
1.0x
0.5x
NM
13.9x
Q2 2019
CMC
3.2x
Q3 2019
2.5x
Q4 2019
01 2020
1.6x
Q2 2020
1.2x
Q3 2020
0.9x
Q4 2020
1.1x 1.2x
Q1 2021
Source: Public filings, Internal data
Notes:
1.0x
Q2 2021
Q3 2021
0.8x 0.7x
Q4 2021
Q1 2022
0.5x
0.7x
Q2 2022
Q3 2022
0.5x 0.4x 0.5x 0.5x
Q4 2022
Q1 2023
Q2 2023
Q3 2023
Net Debt-to-Capitalization4
1. Total debt is defined as long-term debt plus current maturities of long-term debt and short-term borrowings.
2. Net Debt is defined as total debt less cash & cash equivalents.
50%
45%
40%
35%
30%
25%
20%
15%
10%
5%
0%
T
46%
Q2 2019
42%
Q3 2019
37%
Q4 2019
33% 32%
Q1 2020
Q2 2020
3. EBITDA depicted is adjusted EBITDA from continuing operations on a trailing 12-month basis.
4. Net debt-to-capitalization is defined as net debt on CMC's balance sheet divided by the sum of total debt and stockholders' equity.
For a reconciliation of non-GAAP financial measures to the most directly comparable GAAP financial measures, see the appendix to this document.
24%
Q3 2020
21%
18% 2
04 2020
Q1 2021
22%
Q2 2021
20%
Q3 2021
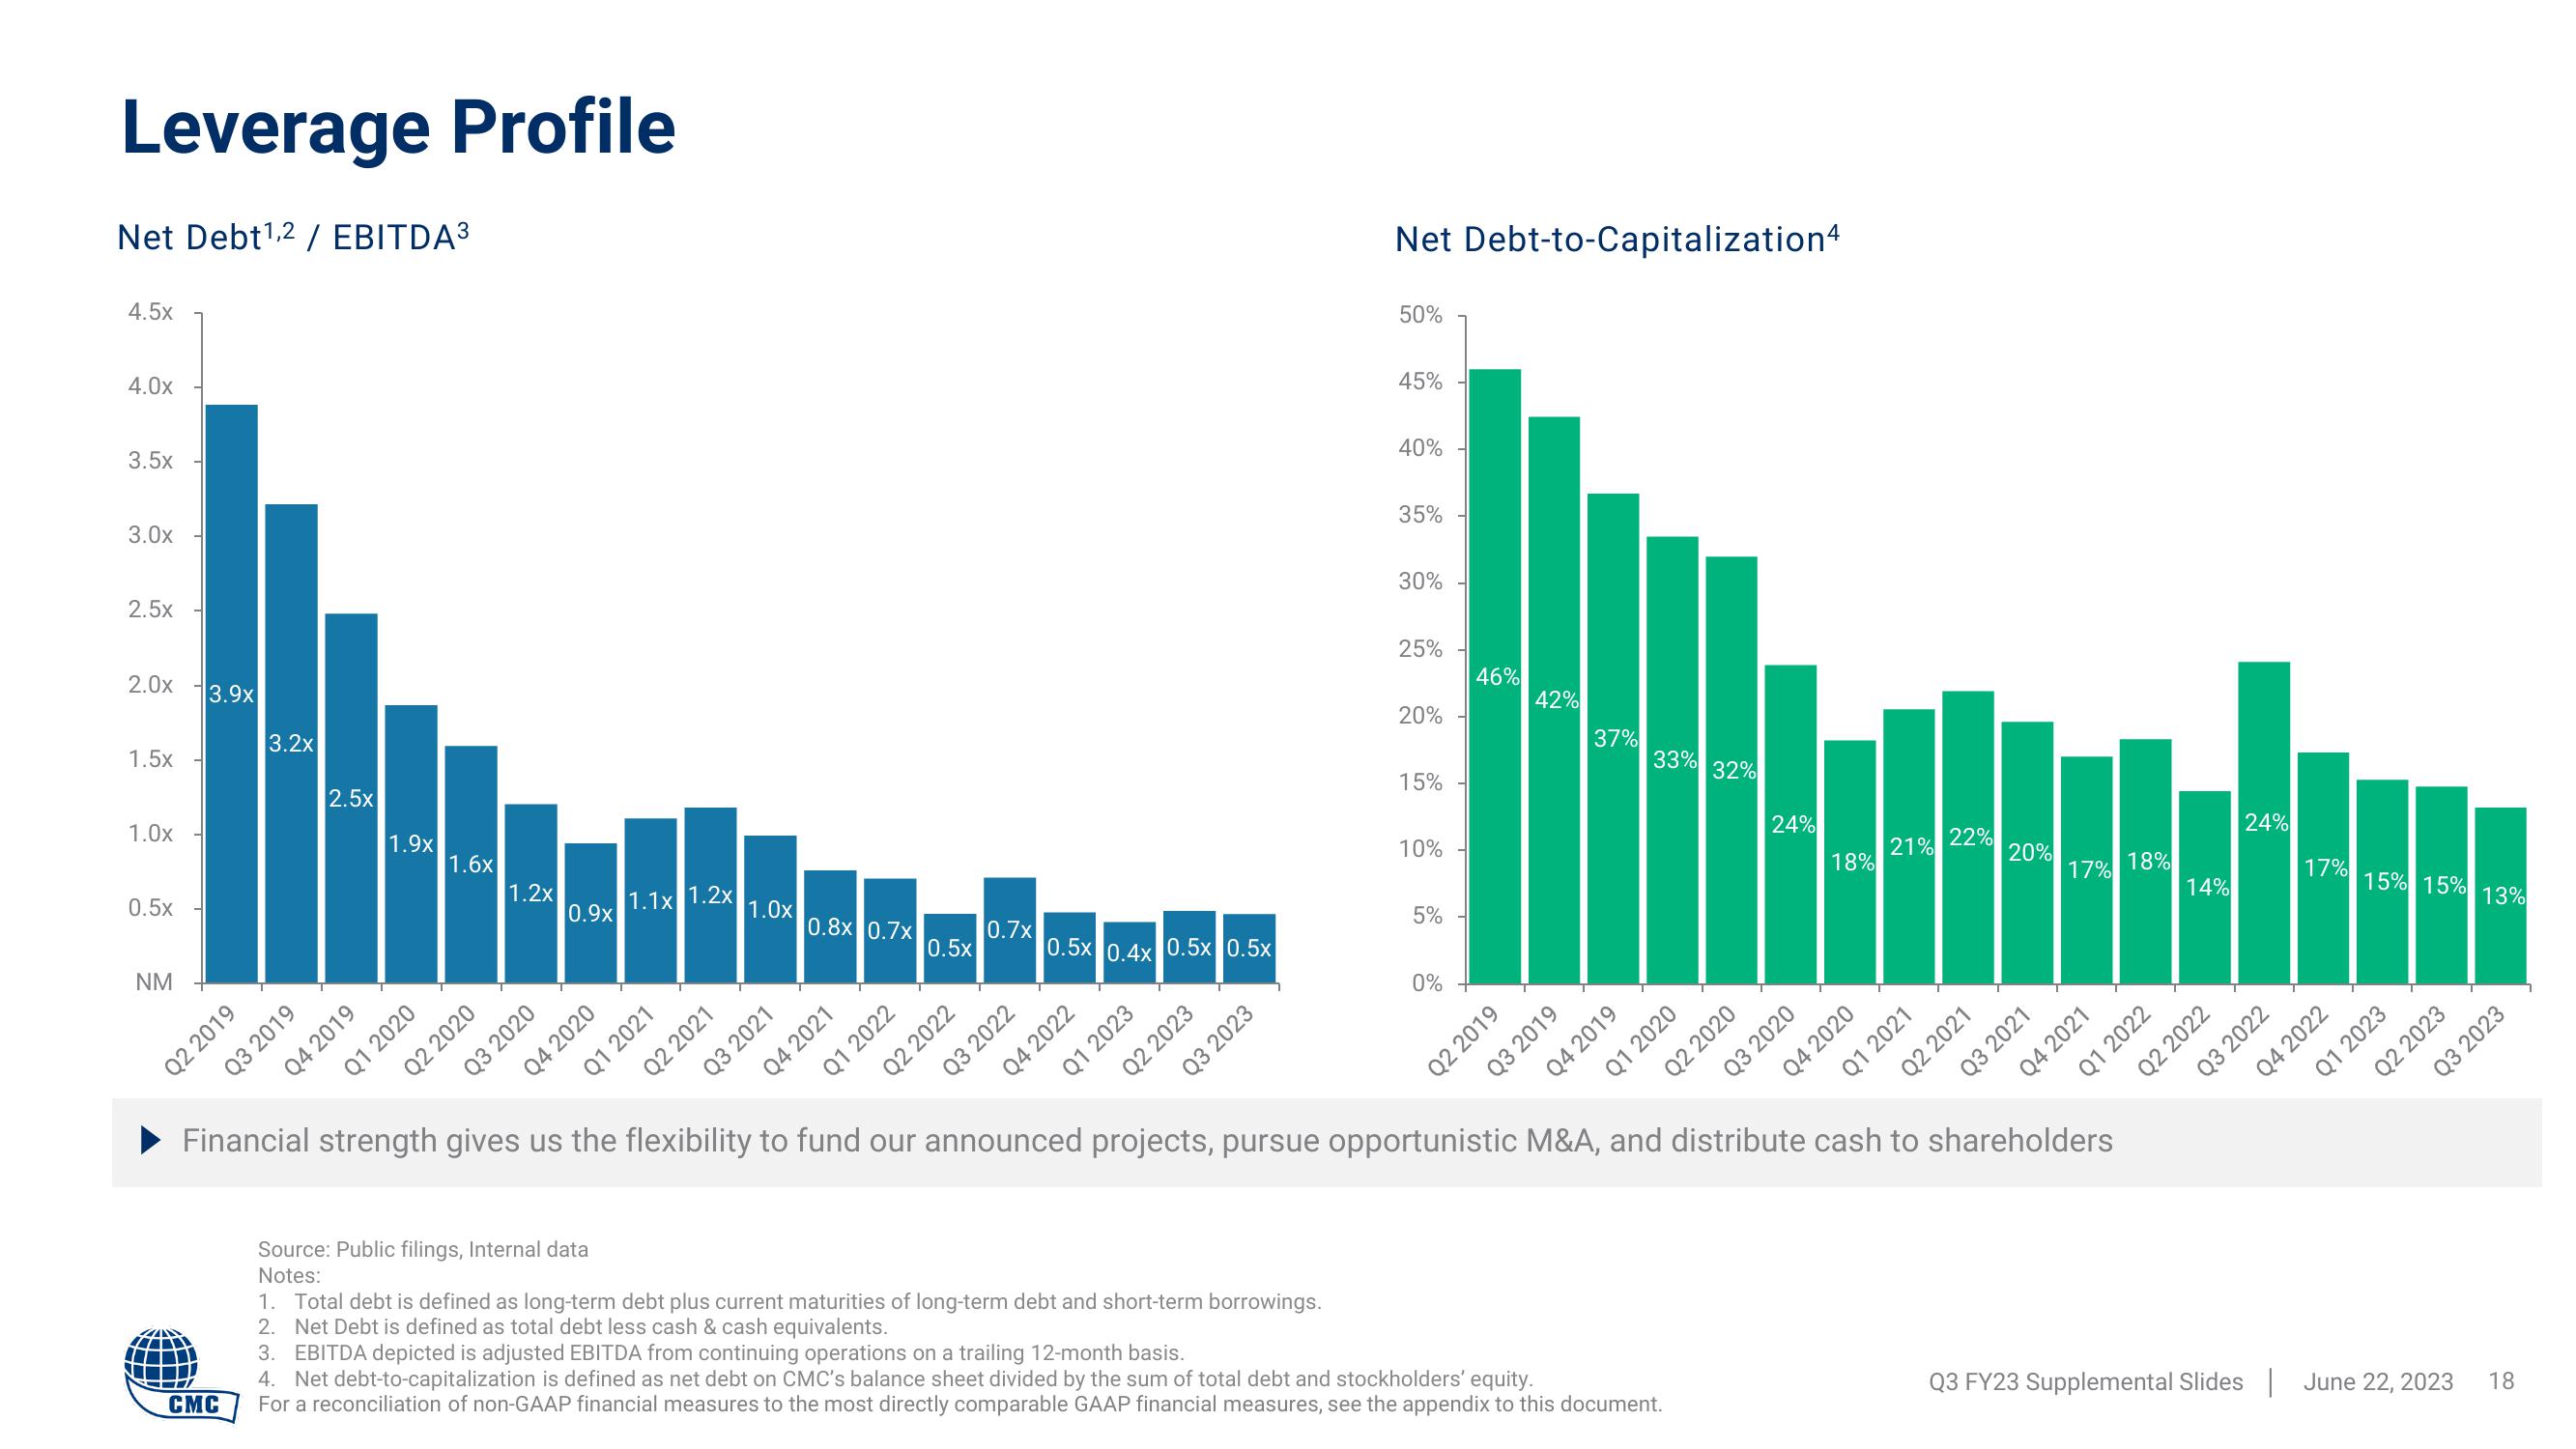
Financial strength gives us the flexibility to fund our announced projects, pursue opportunistic M&A, and distribute cash to shareholders
17%
Q4 2021
18%
Q1 2022
14%
Q2 2022
24%
Q3 2022
17%
Q4 2022
15% 15% 13%
Q1 2023
Q2 2023
Q3 FY23 Supplemental Slides June 22, 2023
Q3 2023
18View entire presentation