Origin SPAC Presentation Deck
Operational
Valuation
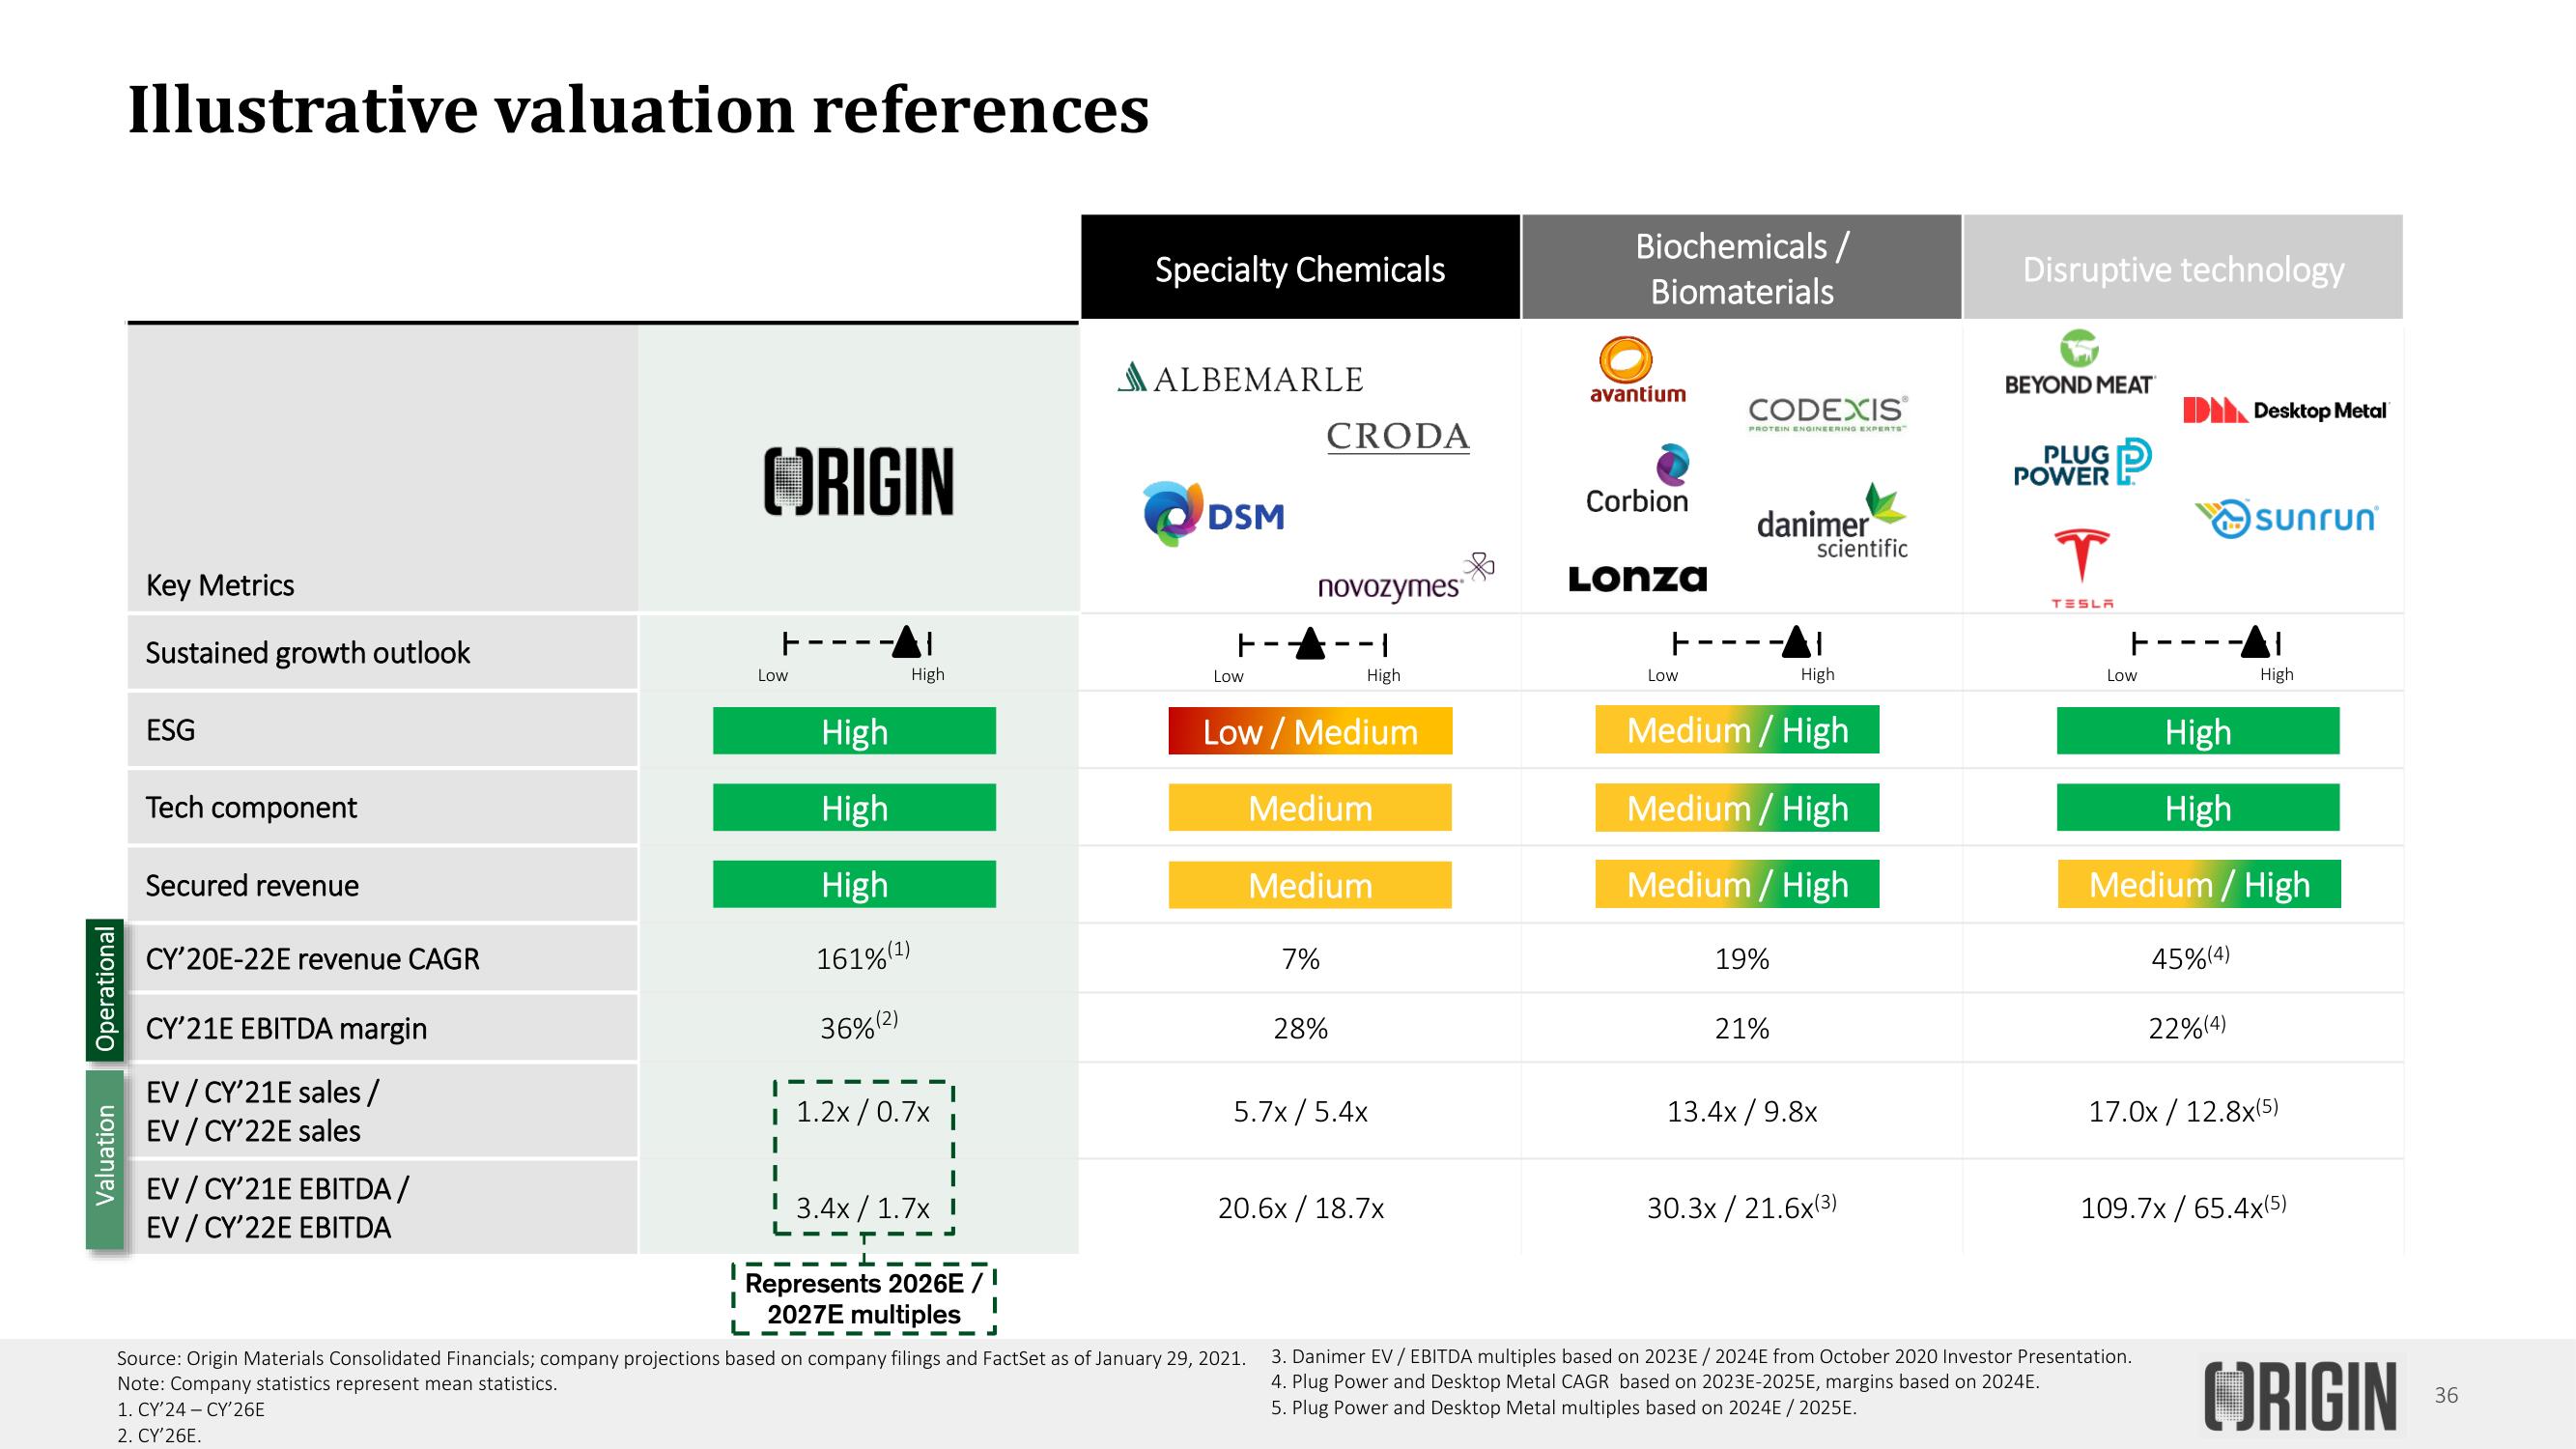
Illustrative valuation references
Key Metrics
Sustained growth outlook
ESG
Tech component
Secured revenue
CY'20E-22E revenue CAGR
CY'21E EBITDA margin
EV/CY'21E sales/
EV/CY'22E sales
EV/CY'21E EBITDA/
EV/CY'22E EBITDA
ORIGIN
I
L
Low
High
High
High
161% (¹)
36% (2)
High
I
I 1.2x/0.7x
I
13.4x / 1.7x
Represents 2026E/
2027E multiples
Specialty Chemicals
AALBEMARLE
DSM
Low
novozymes
-1
High
Low / Medium
CRODA
--L
Source: Origin Materials Consolidated Financials; company projections based on company filings and FactSet as of January 29, 2021.
Note: Company statistics represent mean statistics.
1. CY'24-CY'26E
2. CY'26E.
Medium
Medium
7%
28%
5.7x/5.4x
20.6x/18.7x
Biochemicals/
Biomaterials
avantium
Corbion
Lonza
7--
Low
CODEXIS
PROTEIN ENGINEERING EXPERTS
danimer
19%
scientific
Medium / High
Medium / High
Medium / High
21%
High
13.4x/9.8x
30.3x/ 21.6x(3)
Disruptive technology
BEYOND MEAT
PLUG
POWER
T
TESLA
Low
D Desktop Metal
High
High
Medium / High
45%(4)
3. Danimer EV / EBITDA multiples based on 2023E / 2024E from October 2020 Investor Presentation.
4. Plug Power and Desktop Metal CAGR based on 2023E-2025E, margins based on 2024E.
5. Plug Power and Desktop Metal multiples based on 2024E / 2025E.
sunrun
22%(4)
High
17.0x/ 12.8x(5)
109.7x/65.4x(5)
ORIGIN
36View entire presentation