TPG Results Presentation Deck
AUM Rollforward
■
■
■
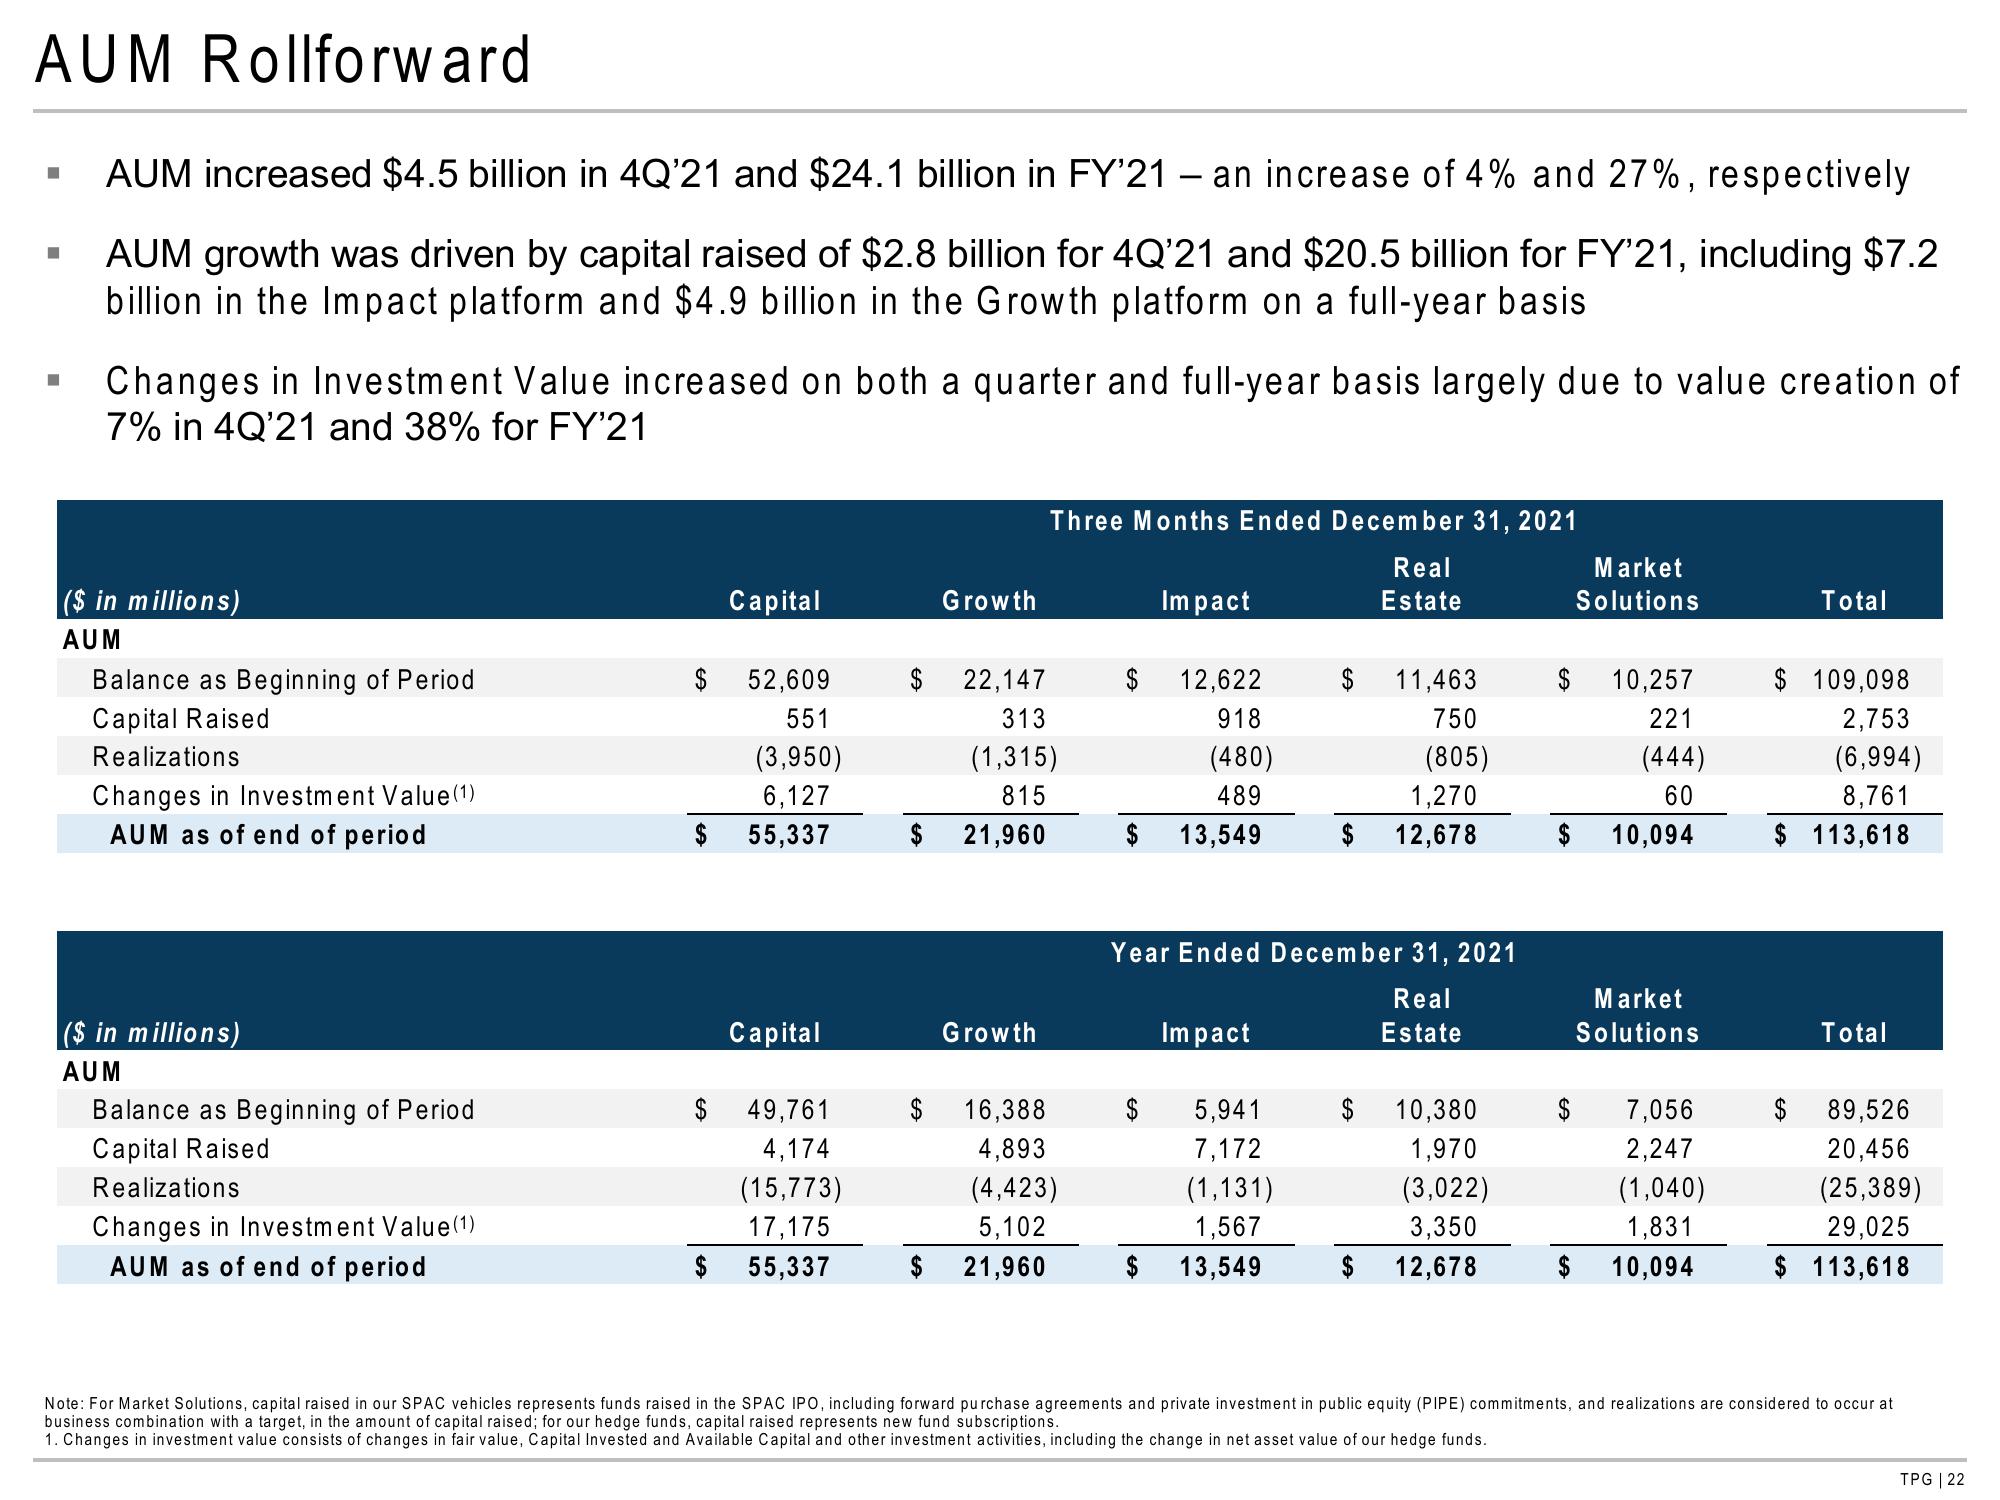
AUM increased $4.5 billion in 4Q'21 and $24.1 billion in FY'21 - an increase of 4% and 27%, respectively
AUM growth was driven by capital raised of $2.8 billion for 4Q'21 and $20.5 billion for FY'21, including $7.2
billion in the Impact platform and $4.9 billion in the Growth platform on a full-year basis
Changes in Investment Value increased on both a quarter and full-year basis largely due to value creation of
7% in 4Q'21 and 38% for FY'21
($ in millions)
AUM
Balance as Beginning of Period
Capital Raised
Realizations
Changes in Investment Value (1)
AUM as of end of period
($ in millions)
AUM
Balance as Beginning of Period
Capital Raised
Realizations
Changes in Investment Value (1)
AUM as of end of period
$
$
Capital
$
52,609
551
(3,950)
6,127
55,337
Capital
$ 49,761
4,174
(15,773)
17,175
55,337
Growth
$ 22,147
313
(1,315)
815
$ 21,960
Growth
Three Months Ended December 31, 2021
Real
Estate
$ 16,388
4,893
(4,423)
5,102
$ 21,960
Impact
12,622
918
(480)
489
13,549
Impact
$ 11,463
750
(805)
Year Ended December 31, 2021
Real
Estate
5,941
7,172
(1,131)
1,567
13,549
1,270
$ 12,678
$ 10,380
1,970
(3,022)
3,350
$ 12,678
Market
Solutions
10,257
221
(444)
60
$ 10,094
Market
Solutions
7,056
2,247
(1,040)
1,831
$ 10,094
Total
$ 109,098
2,753
(6,994)
8,761
$ 113,618
$
Total
89,526
20,456
(25,389)
29,025
$ 113,618
Note: For Market Solutions, capital raised in our SPAC vehicles represents funds raised in the SPAC IPO, including forward purchase agreements and private investment in public equity (PIPE) commitments, and realizations are considered to occur at
business combination with a target, in the amount of capital raised; for our hedge funds, capital raised represents new fund subscriptions.
1. Changes in investment value consists of changes in fair value, Capital Invested and Available Capital and other investment activities, including the change in net asset value of our hedge funds.
TPG | 22View entire presentation