Solar Industry Update
$3,500
$3,000
NREL Bottom-Up Cost Modeling:
Q1 2023 Installed Cost Benchmarks
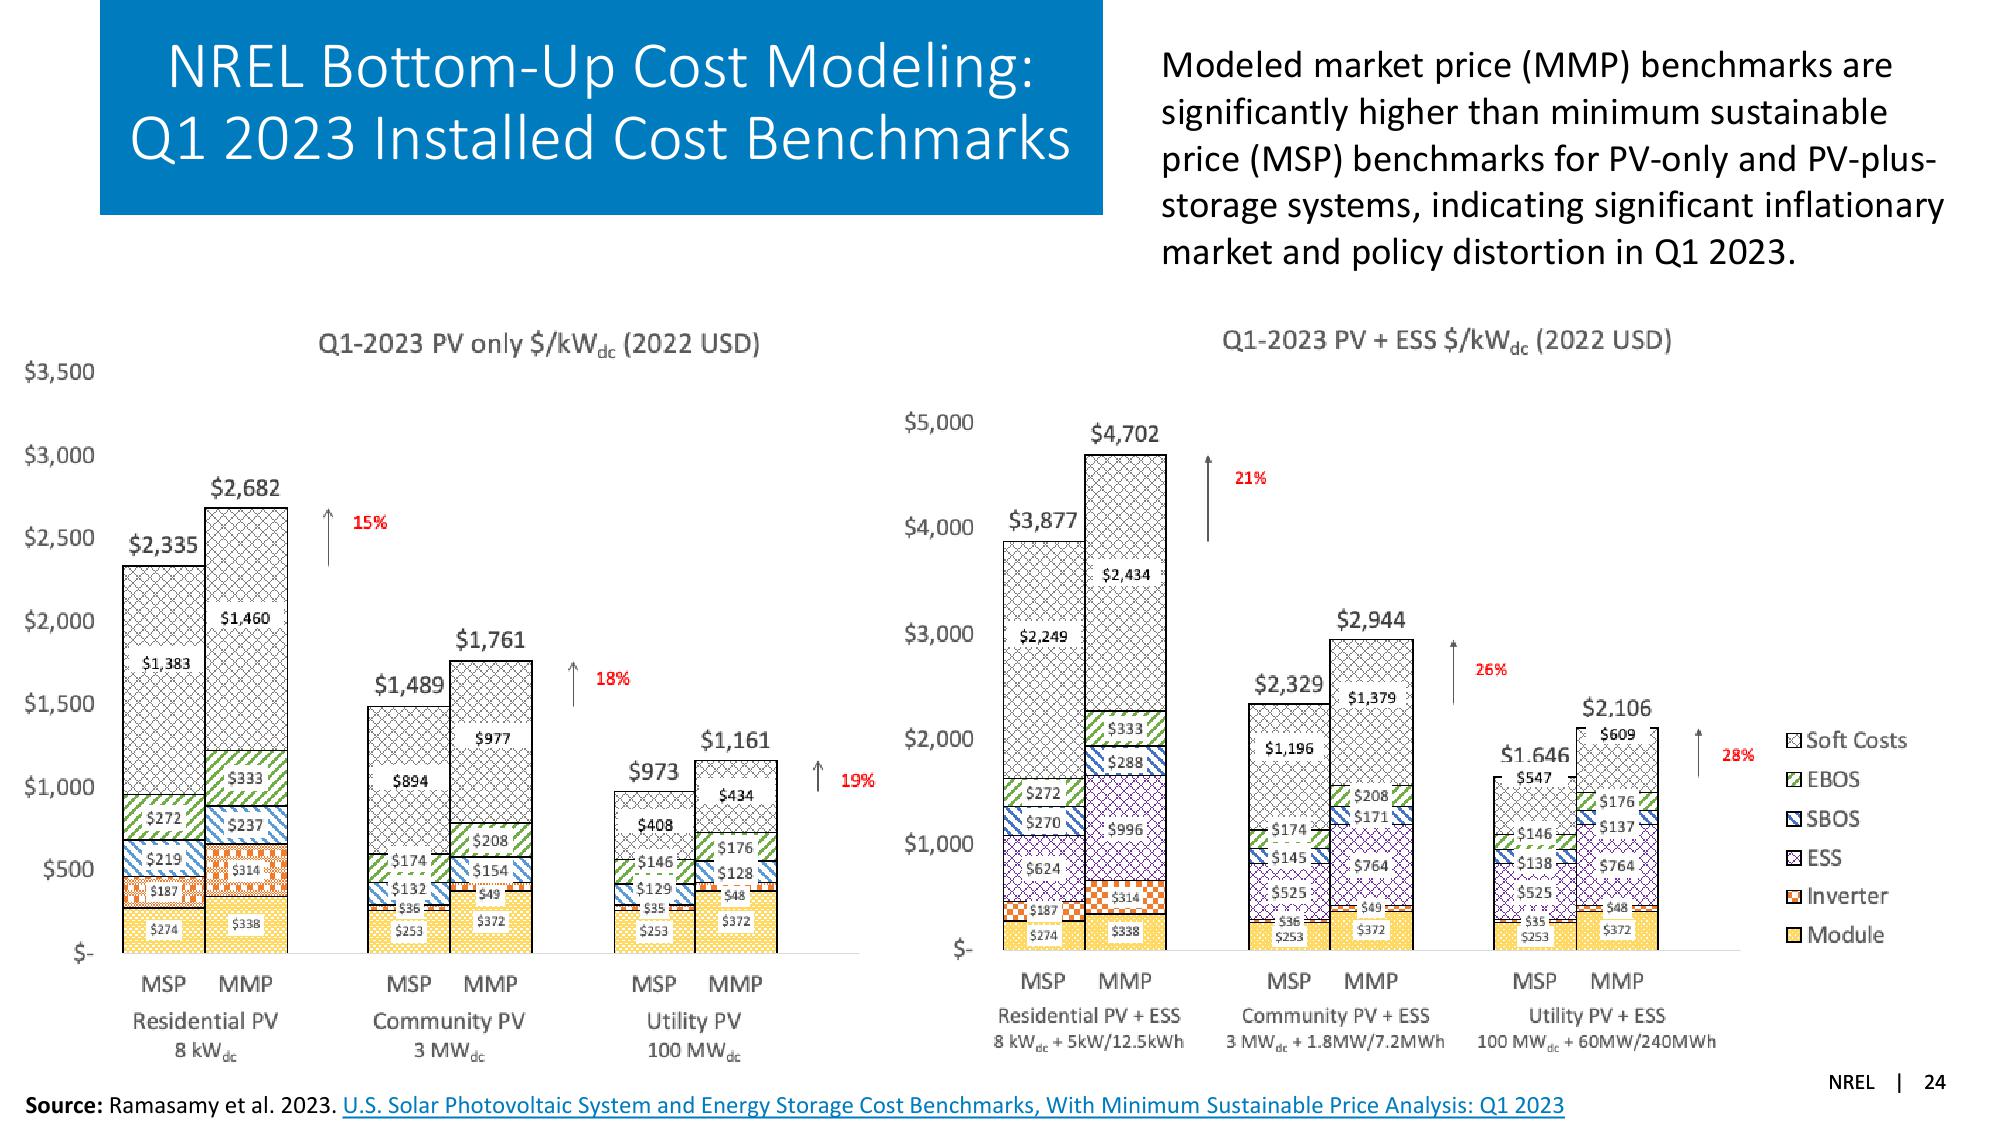
Q1-2023 PV only $/kWdc (2022 USD)
Modeled market price (MMP) benchmarks are
significantly higher than minimum sustainable
price (MSP) benchmarks for PV-only and PV-plus-
storage systems, indicating significant inflationary
market and policy distortion in Q1 2023.
Q1-2023 PV + ESS $/kWdc (2022 USD)
$2,682
15%
$2,500
$2,335
$2,000
$1,460
$1,383
$1,500
$1,761
$1,489
18%
$5,000
$4,702
21%
$4,000 $3,877
$2,434
$2,944
$3,000 $2,249
26%
$2,329
$1,379
$2,106
$333
$609
Soft Costs
$1,196
$1.646
28%
$288)
$547
EBOS
$272
$208
$176
$171
$270
SBOS
$996
$174
$137
$146
$1,000
$145)
$624
$764
$138 5764
☑ESS
XXXXX
चालत
$525
$525
$314
Inverter
$187
محد 536 عصر
$274
$338
$49
$372
اثر گاه کره بان
$253
$35
5253
548
$372
Module
$977
$1,161
$2,000
$1,000
$333
$973
$894
19%
$434
$272
$237
$408
$208
$176
$219
$174
$500
$146
$314
$154
$128
$187
$132
$129
$49
$48
$36
$35
$274
$338
$372
$372
$253
$253
MSP
MMP
Residential PV
8 kW dc
MSP MMP
Community PV
MSP MMP
Utility PV
3 MWdc
100 MWdc
MSP MMP
Residential PV + ESS
8 kW + 5kW/12.5kWh
MSP MMP
Community PV + ESS
3 MW +1.8MW/7.2MWh
MSP
MMP
Utility PV + ESS
100 MW +60MW/240MWh
Source: Ramasamy et al. 2023. U.S. Solar Photovoltaic System and Energy Storage Cost Benchmarks, With Minimum Sustainable Price Analysis: Q1 2023
NREL 24View entire presentation