Confluent IPO Presentation Deck
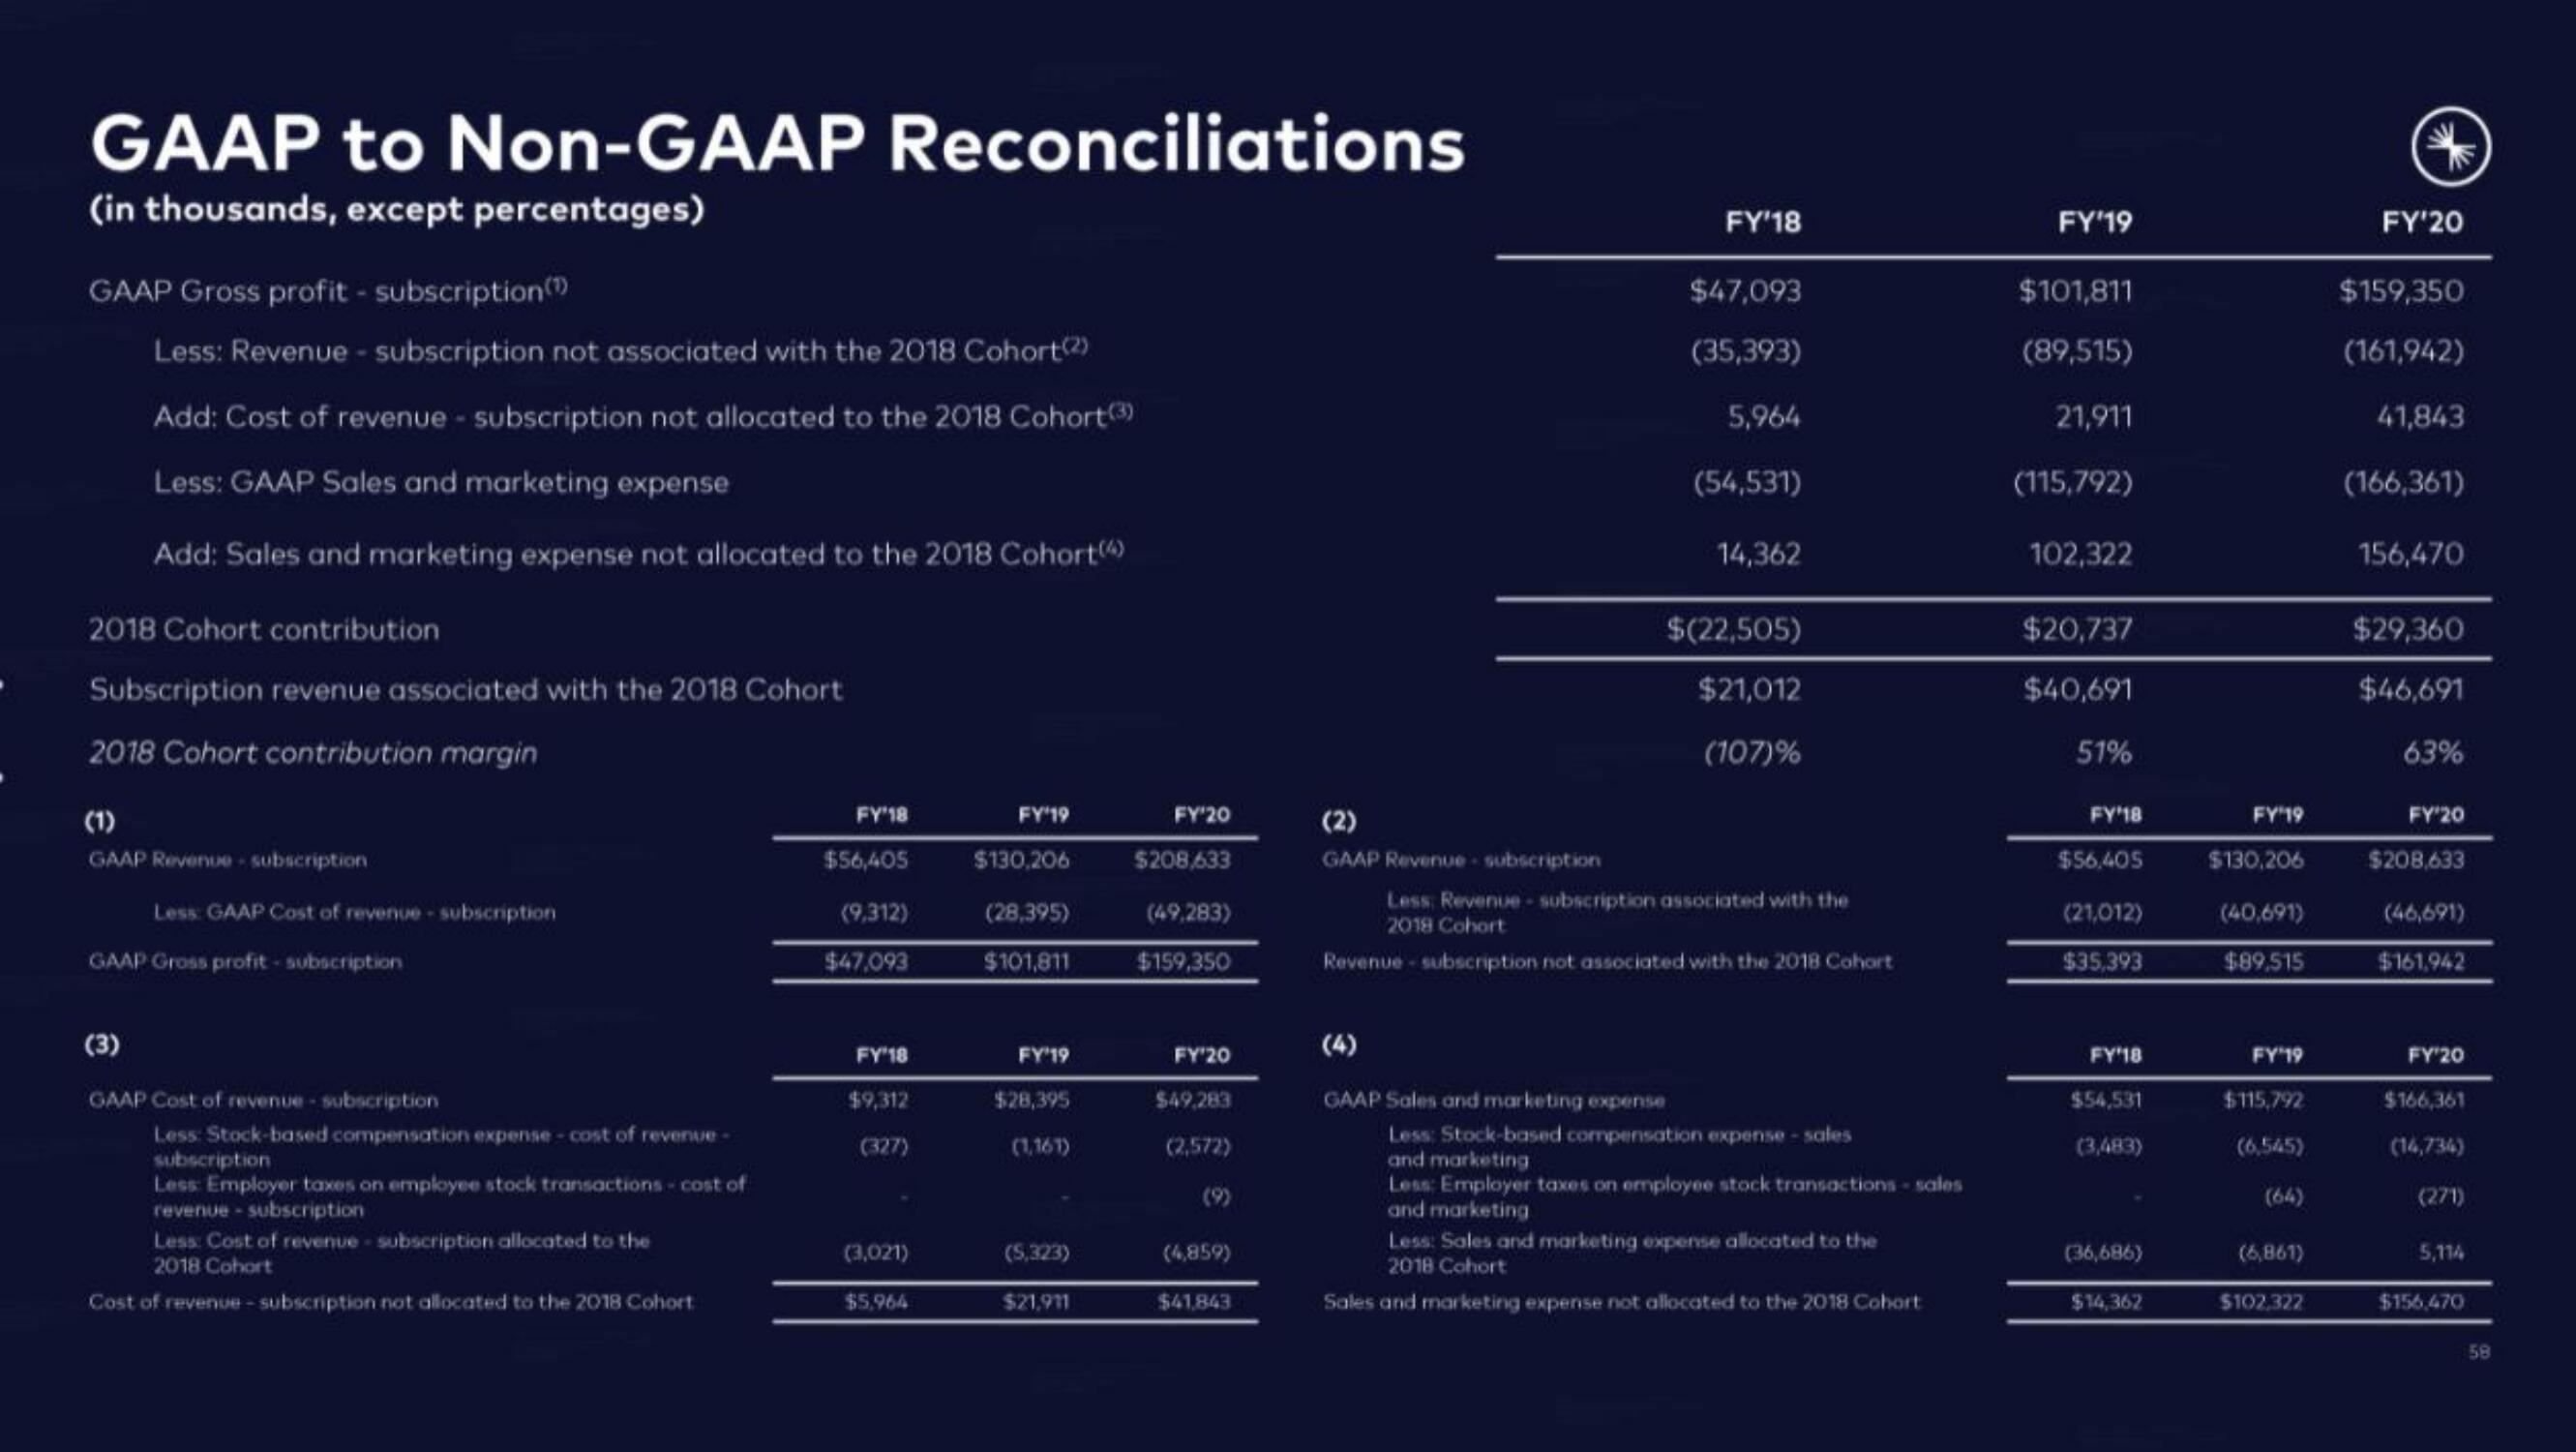
GAAP to Non-GAAP Reconciliations
(in thousands, except percentages)
GAAP Gross profit - subscription()
Less: Revenue - subscription not associated with the 2018 Cohort(2)
Add: Cost of revenue subscription not allocated to the 2018 Cohort (3)
Less: GAAP Sales and marketing expense
Add: Sales and marketing expense not allocated to the 2018 Cohort(4)
2018 Cohort contribution
Subscription revenue associated with the 2018 Cohort
2018 Cohort contribution margin
GAAP Revenue- subscription
Less: GAAP Cost of revenue -subscription
GAAP Gross profit-subscription
(3)
GAAP Cost of revenue- subscription
Less: Stock-based compensation expense-cost of revenue-
subscription
Less: Employer taxes on employee stock transactions - cost of
revenue -subscription
Less: Cost of revenue- subscription allocated to the
2018 Cohort
Cost of revenue -subscription not allocated to the 2018 Cohort
FY'18
$56,405
(9,312)
$47,093
FY'18
$9,312
(327)
(3,021)
$5,964
FY'19
$130,206
(28,395)
$101,811
FY'19
$28,395
(1,167)
(5,323)
$21,911
FY'20
$208,633
(49,283)
$159,350
FY'20
$49,283
(2,572)
(4,859)
$41,843
(2)
GAAP Revenue subscription
FY'18
$47,093
(35,393)
5,964
(54,531)
GAAP Sales and marketing expense
14,362
$(22,505)
$21,012
(107)%
Less: Revenue -subscription associated with the
2018 Cohort
Revenue subscription not associated with the 2018 Cohort
Less: Stock-based compensation expense - sales
and marketing
Less: Employer taxes on employee stock transactions - sales
and marketing
Less: Sales and marketing expense allocated to the
2018 Cohort
Sales and marketing expense not allocated to the 2018 Cohort
FY'19
$101,811
(89,515)
21,911
(115,792)
102,322
$20,737
$40,691
51%
FY'18
$56,405
(21,012)
$35,393
FY'18
$54,531
(3,483)
(36,686)
$14,362
FY'19
$130,206
(40,691)
$89.515
FY'19
$115,792
(6,545)
(6,861)
$102,322
FY'20
$159,350
(161,942)
41,843
(166,361)
156,470
$29,360
$46,691
63%
FY'20
$208,633
(46,691)
$161,942
FY'20
$166,361
(14,734)
(271)
5,114
$156,470
58View entire presentation