Centrica Results Presentation Deck
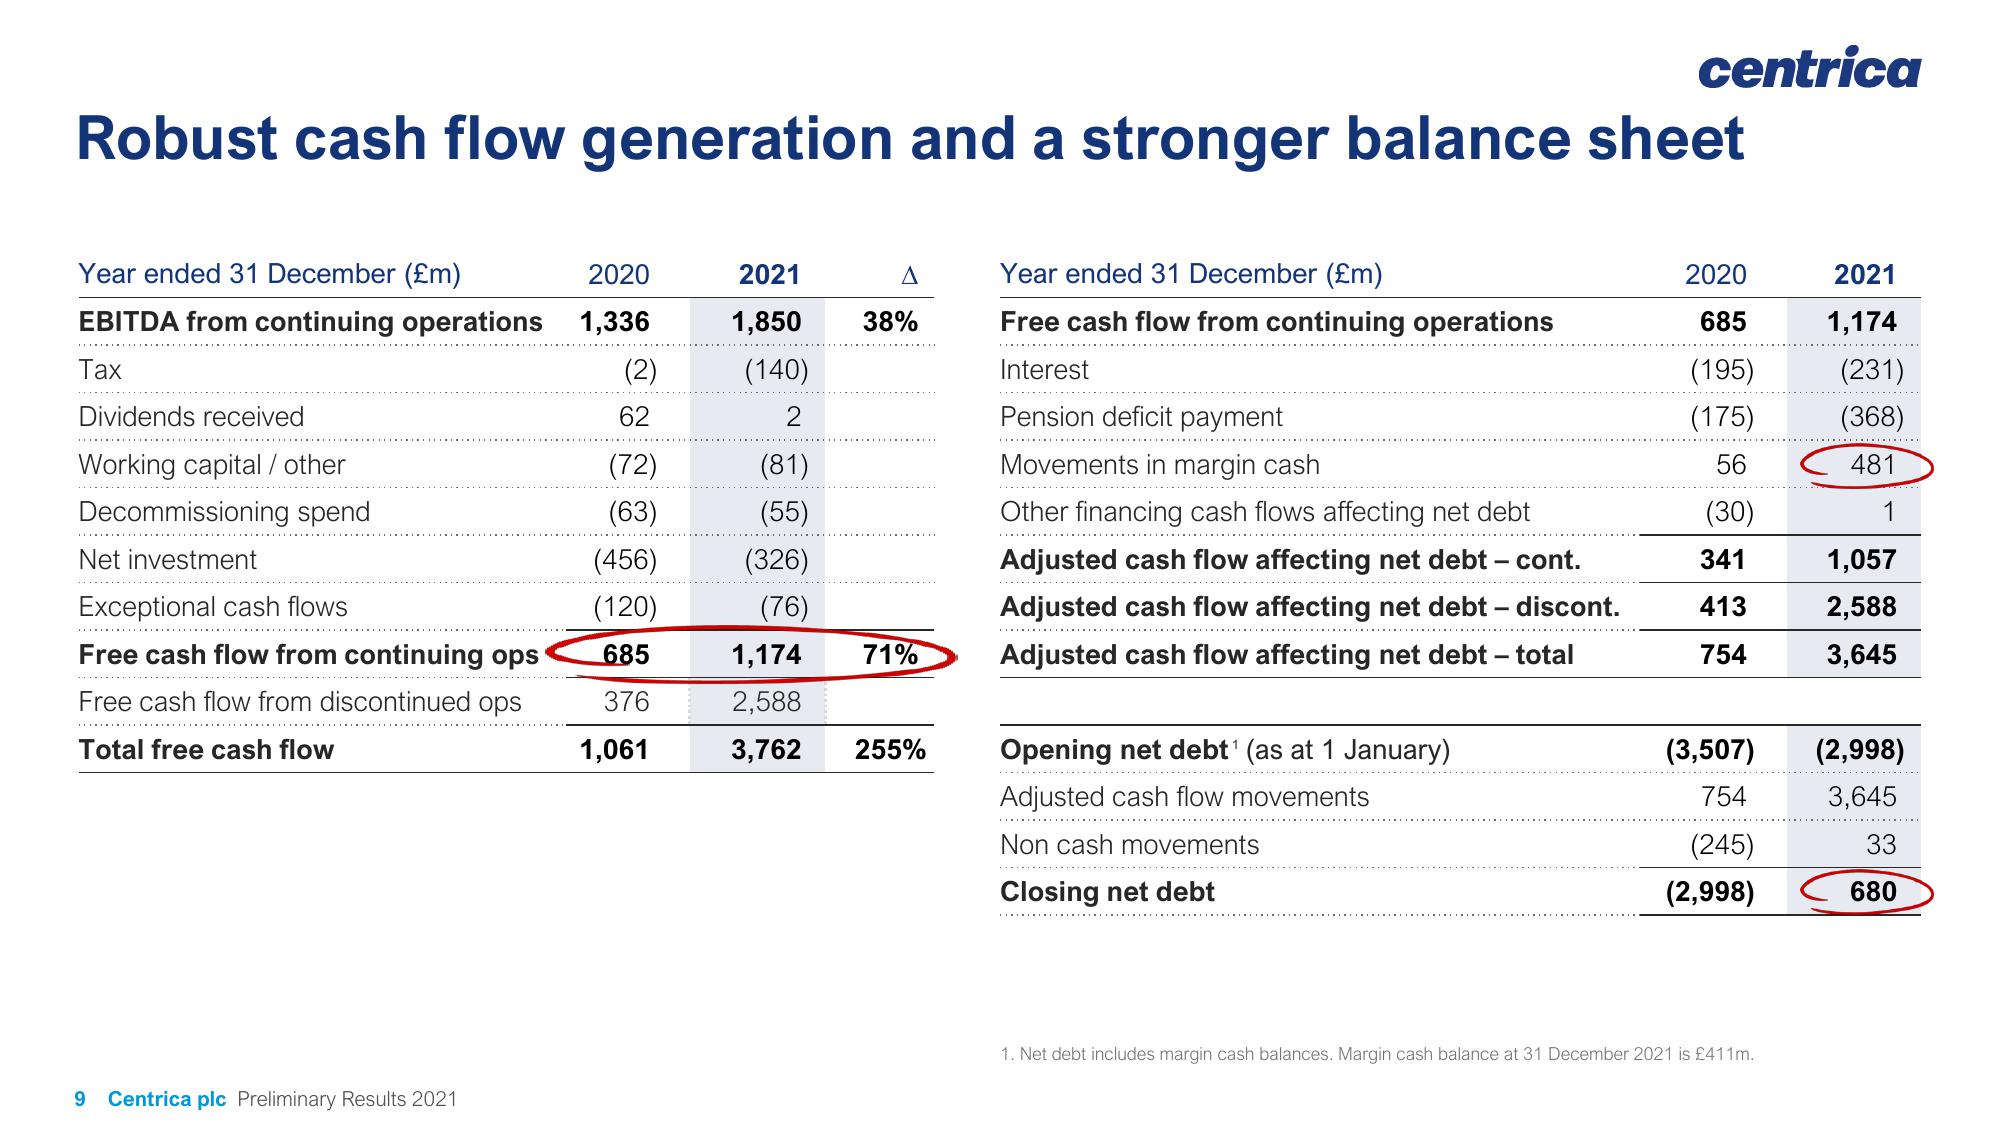
Robust cash flow generation and a stronger balance sheet
Year ended 31 December (£m)
EBITDA from continuing operations
Tax
Dividends received
Working capital / other
Decommissioning spend
Net investment
Exceptional cash flows
Free cash flow from continuing ops
Free cash flow from discontinued ops
Total free cash flow
9 Centrica plc Preliminary Results 2021
2020
1,336
(2)
62
(72)
(63)
(456)
(120)
685
376
1,061
2021
1,850
(140)
2
(81)
(55)
(326)
(76)
1,174
2,588
3,762
A
38%
71%
255%
Year ended 31 December (£m)
Free cash flow from continuing operations
Interest
Pension deficit payment
Movements in margin cash
Other financing cash flows affecting net debt
Adjusted cash flow affecting net debt - cont.
Adjusted cash flow affecting net debt - discont.
Adjusted cash flow affecting net debt - total
centrica
Opening net debt ¹ (as at 1 January)
Adjusted cash flow movements
Non cash movements
Closing net debt
2020
685
(195)
(175)
56
(30)
341
413
754
(3,507)
754
(245)
(2,998)
1. Net debt includes margin cash balances. Margin cash balance at 31 December 2021 is £411m.
2021
1,174
(231)
(368)
481
1
1,057
2,588
3,645
(2,998)
3,645
33
680View entire presentation