Silicon Valley Bank Results Presentation Deck
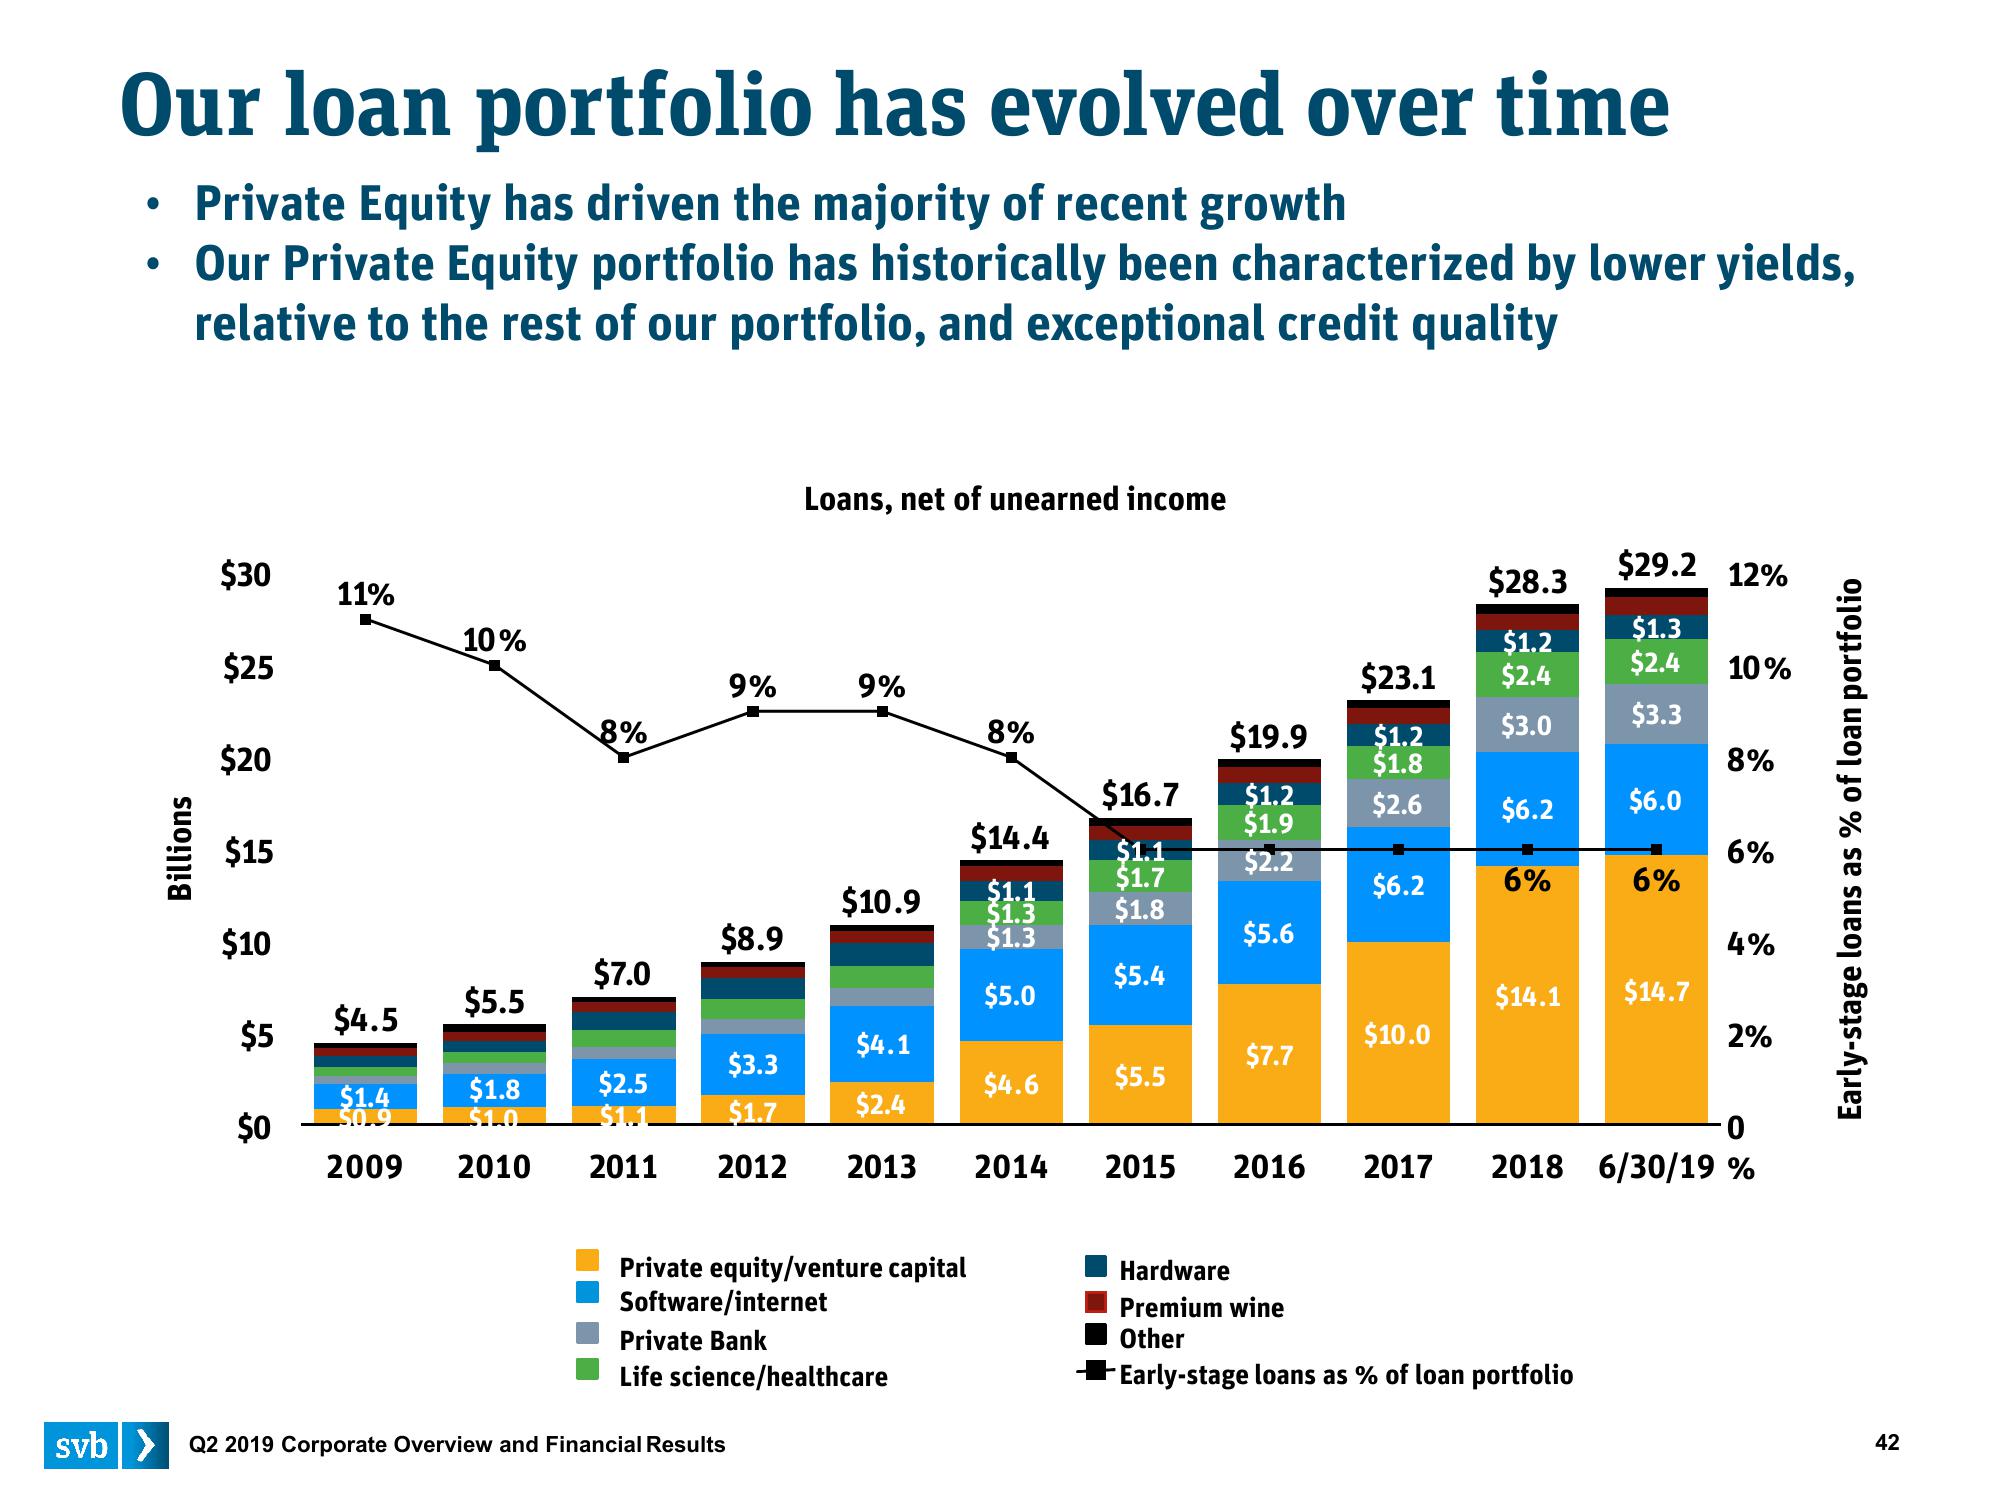
Our loan portfolio has evolved over time
• Private Equity has driven the majority of recent growth
Our Private Equity portfolio has historically been characterized by lower yields,
relative to the rest of our portfolio, and exceptional credit quality
Billions
$30
$25
$20
$15
$10
$5
$0
11%
$4.5
$1.4
$0.9
2009
10%
$5.5
$1.8
$1.0
2010
8%
$7.0
9%
$2.5
$8.9
Loans, net of unearned income
9%
$10.9
svb> Q2 2019 Corporate Overview and Financial Results
$4.1
$3.3
$1.7
$2.4
2011 2012 2013 2014
Private equity/venture capital
Software/internet
Private Bank
Life science/healthcare
8%
$14.4
$1.1
$1.3
$1.3
$5.0
$4.6
$16.7
$1.1
$1.7
$1.8
$5.4
$5.5
2015
$19.9
$1.2
$1.9
$2.2
$5.6
$7.7
$23.1
$1.2
$1.8
$2.6
$6.2
$10.0
2016 2017
$28.3
$1.2
$2.4
$3.0
$6.2
6%
$14.1
$29.2 12%
$1.3
$2.4
$3.3
Hardware
Premium wine
Other
Early-stage loans as % of loan portfolio
$6.0
6%
$14.7
10%
8%
6%
4%
2%
0
2018 6/30/19 %
Early-stage loans as % of loan portfolio
42View entire presentation