Porch SPAC Presentation Deck
Financial Results and Projections
Revenue (5 mm)
$36
2018PF
% Growth
49% CAGR
$57
2019PF
55%
167% CAGR
$11
$85 m)
(3)
$73
2020E
28% 49%
Contribution Margin ($mm)
$26
(1)
$120
2021E
64% 41%
$53
(2)
Gross Profit ($ mm)
$29
81%
2018PF
% Growth
49% CAGR
$47
-$29
2018PF
83%
2019PF
60%
Gross Profit
-$30
2019PF
$68 m)
$57
Adjusted EBITDA ($mm)
78%
2020E
21% 45%
-$10
(1)
2020E
-Gross Margin
$97
81%
$3
2018PF
2019PF
2020E
161%
2021E
87%
% Growth
292%
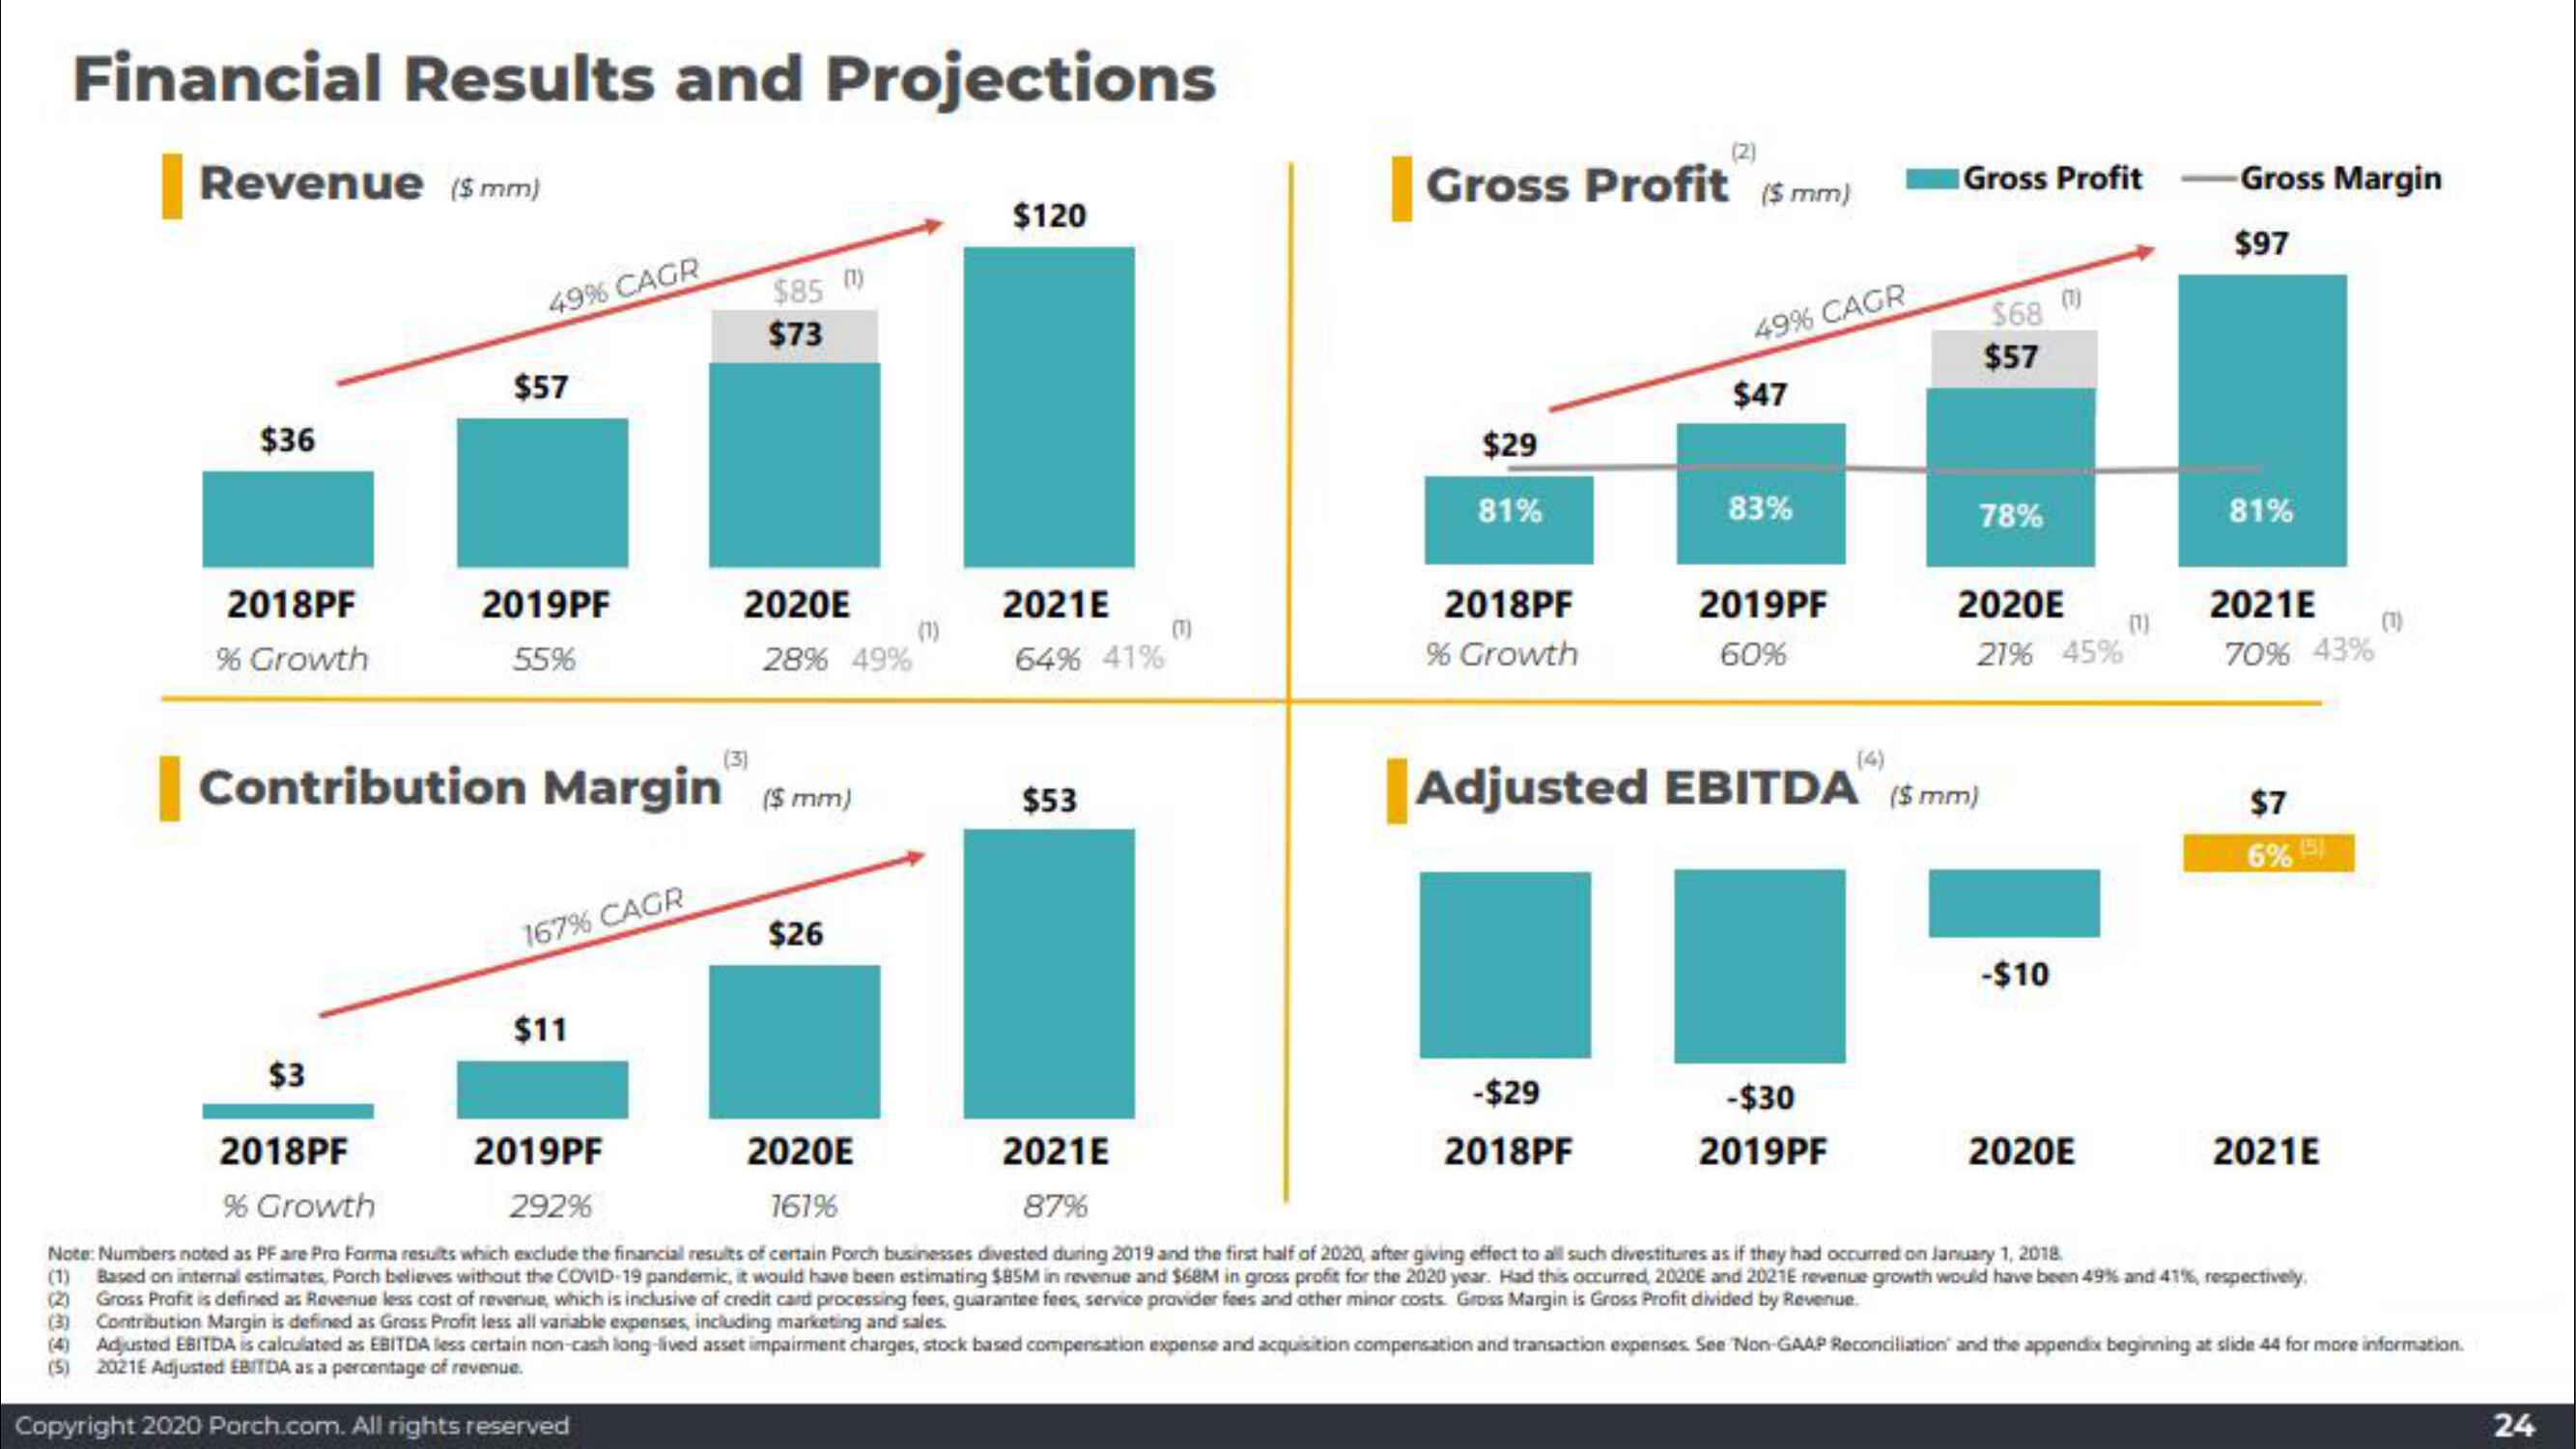
Note: Numbers noted as PF are Pro Forma results which exclude the financial results of certain Porch businesses divested during 2019 and the first half of 2020, after giving effect to all such divestitures as if they had occurred on January 1, 2018.
(1) Based on internal estimates, Porch believes without the COVID-19 pandemic, it would have been estimating $85M in revenue and $68M in gross profit for the 2020 year. Had this occurred, 2020E and 2021E revenue growth would have been 49% and 41%, respectively.
(2) Gross Profit is defined as Revenue less cost of revenue, which is inclusive of credit card processing fees, guarantee fees, service provider fees and other minor costs. Gross Margin is Gross Profit divided by Revenue.
(3) Contribution Margin is defined as Grass Profit less all variable expenses, including marketing and sales.
2021E
70% 43%
$7
6% 5)
2021E
Adjusted EBITDA is calculated as EBITDA less certain non-cash long-lived asset impairment charges, stock based compensation expense and acquisition compensation and transaction expenses. See Non-GAAP Reconciliation and the appendix beginning at slide 44 for more information.
(5) 2021E Adjusted EBITDA as a percentage of revenue.
Copyright 2020 Porch.com. All rights reserved
24View entire presentation