Sotheby's Investor Presentation Deck
APPENDIX
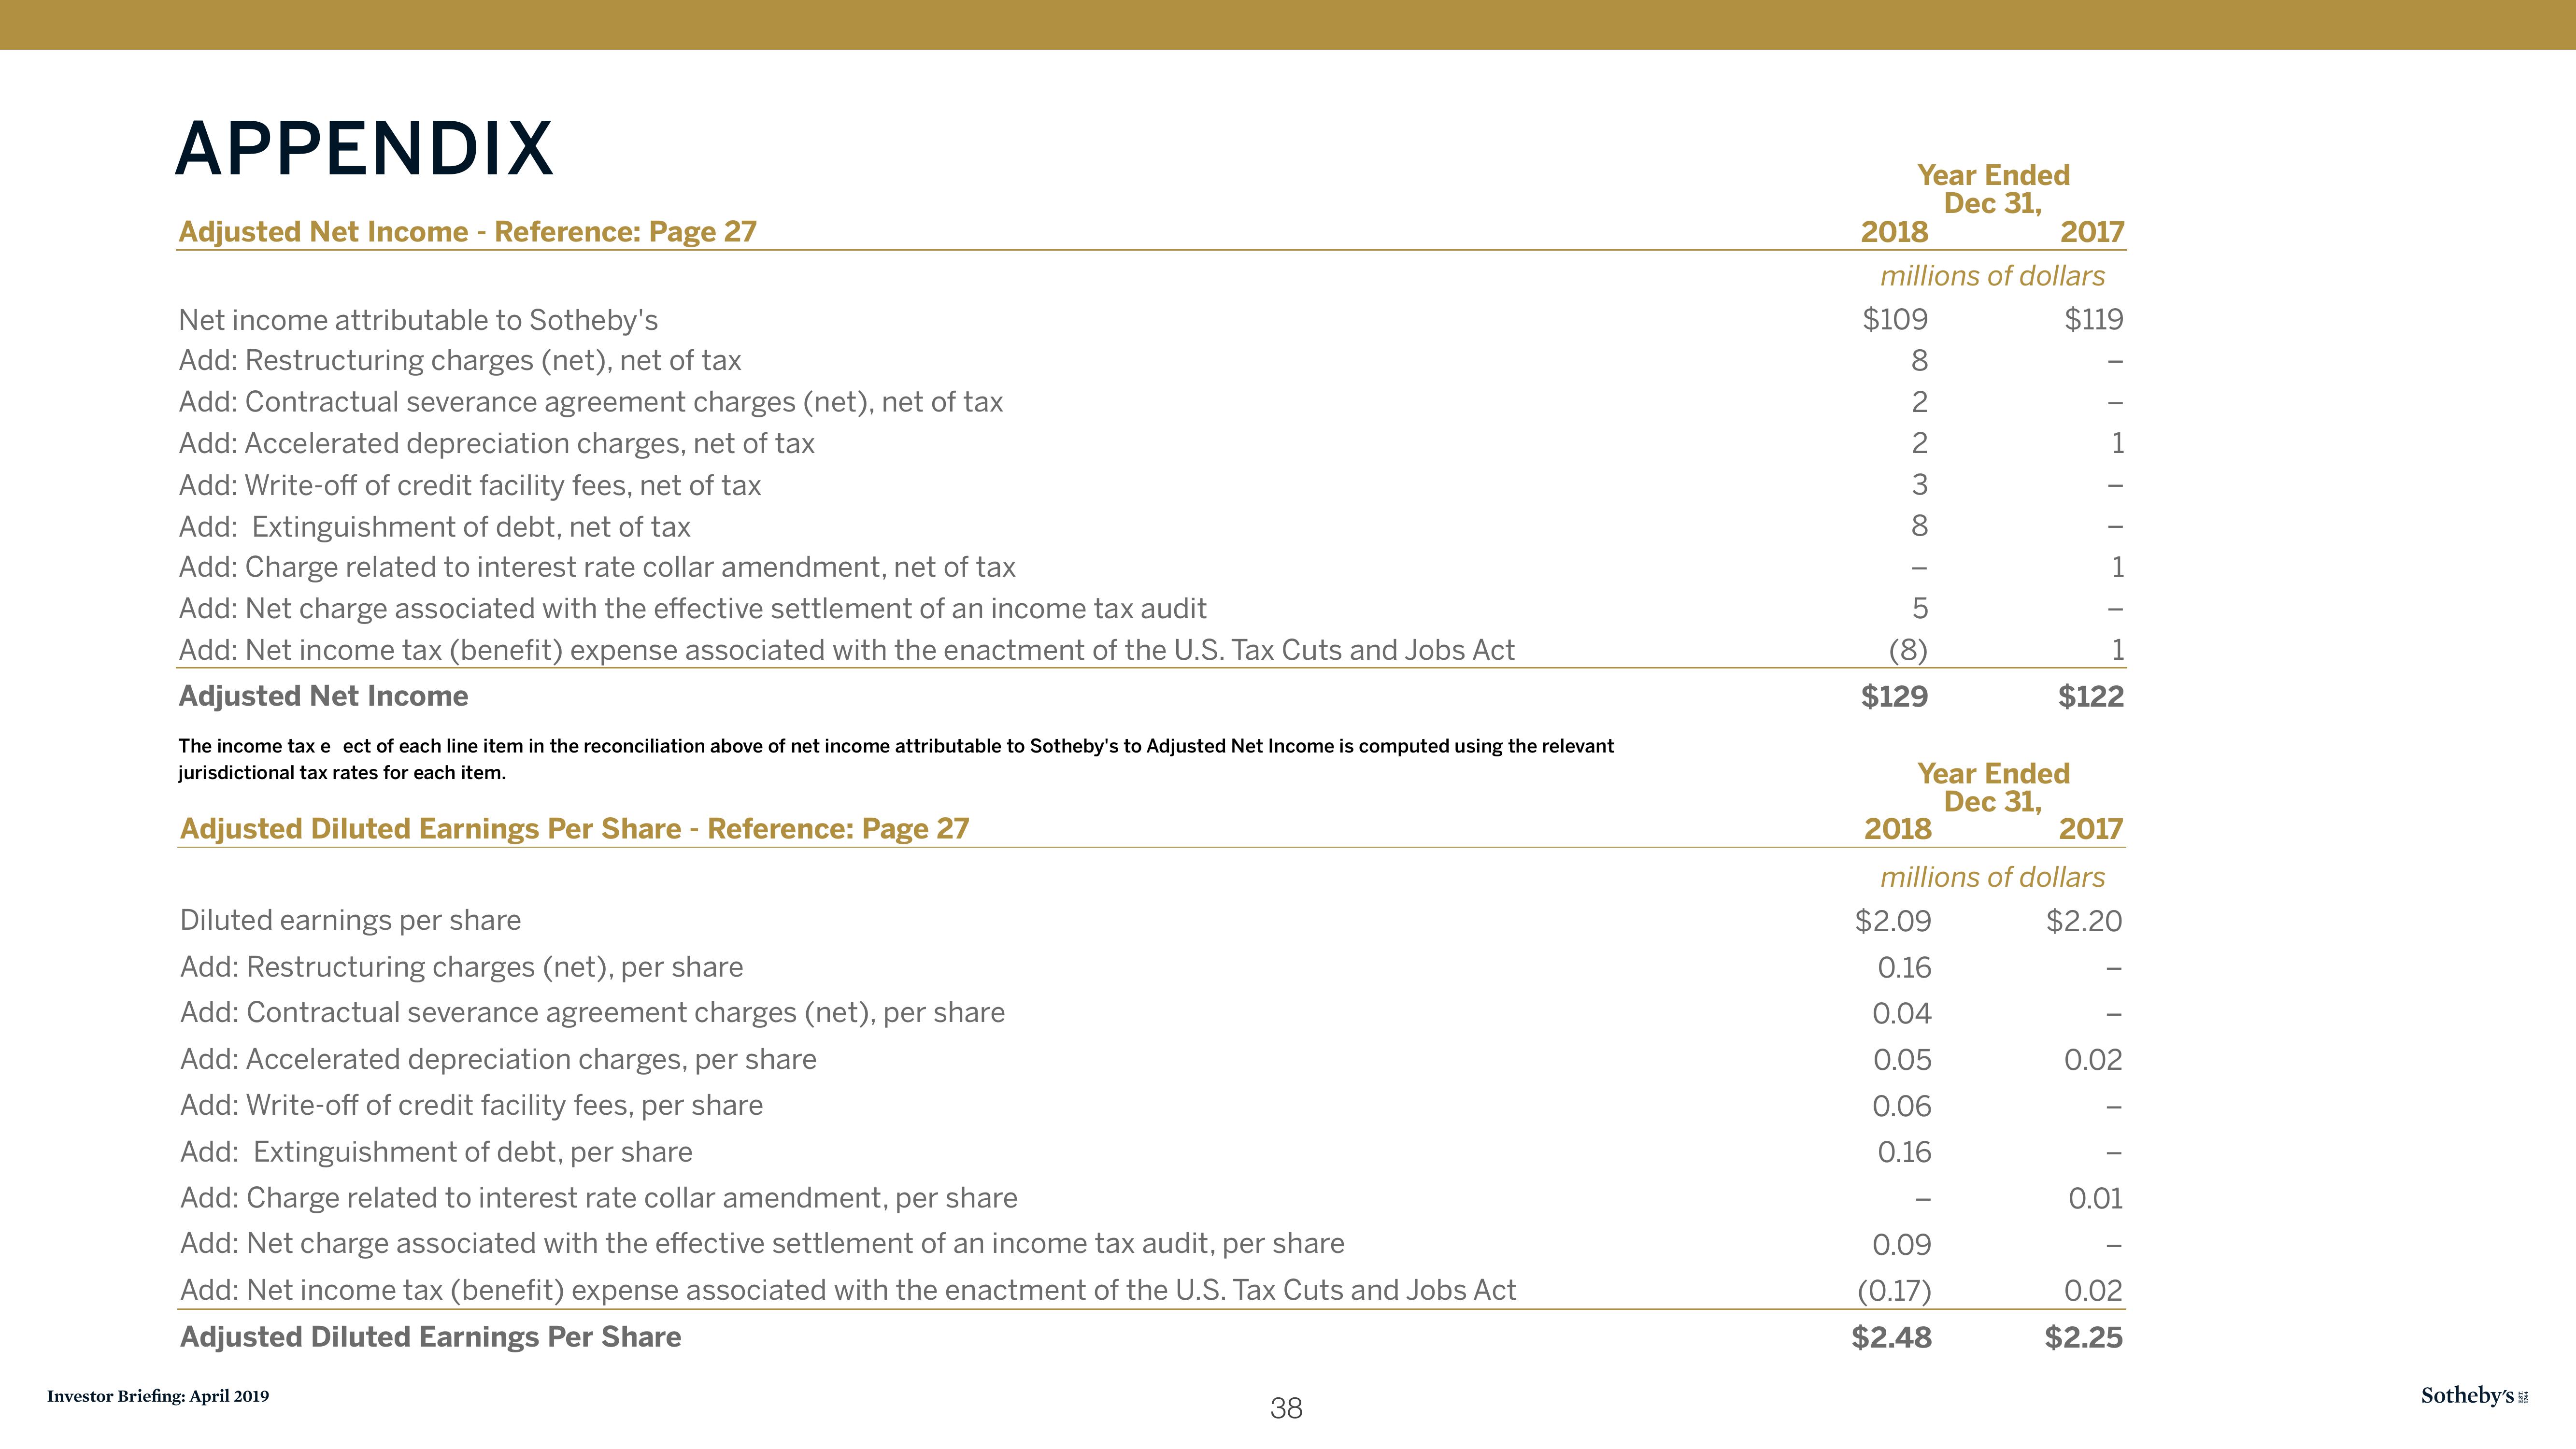
Adjusted Net Income - Reference: Page 27
Net income attributable to Sotheby's
Add: Restructuring charges (net), net of tax
Add: Contractual severance agreement charges (net), net of tax
Add: Accelerated depreciation charges, net of tax
Add: Write-off of credit facility fees, net of tax
Add: Extinguishment of debt, net of tax
Add: Charge related to interest rate collar amendment, net of tax
Add: Net charge associated with the effective settlement of an income tax audit
Add: Net income tax (benefit) expense associated with the enactment of the U.S. Tax Cuts and Jobs Act
Adjusted Net Income
The income tax e ect of each line item in the reconciliation above of net income attributable to Sotheby's to Adjusted Net Income is computed using the relevant
jurisdictional tax rates for each item.
Adjusted Diluted Earnings Per Share - Reference: Page 27
Diluted earnings per share
Add: Restructuring charges (net), per share
Add: Contractual severance agreement charges (net), per share
Add: Accelerated depreciation charges, per share
Add: Write-off of credit facility fees, per share
Add: Extinguishment of debt, per share
Add: Charge related to interest rate collar amendment, per share
Add: Net charge associated with the effective settlement of an income tax audit, per share
Add: Net income tax (benefit) expense associated with the enactment of the U.S. Tax Cuts and Jobs Act
Adjusted Diluted Earnings Per Share
Investor Briefing: April 2019
38
Year Ended
Dec 31,
2018
2017
millions of dollars
$109
$119
8
100 W NN
2
2
3
8
5
(8)
$129
Year Ended
Dec 31,
$2.09
0.16
0.04
0.05
0.06
0.16
1
0.09
(0.17)
$2.48
1
1
$122
2018
2017
millions of dollars
$2.20
0.02
0.01
0.02
$2.25
Sotheby'sView entire presentation