Lanvin Results Presentation Deck
ST. JOHN 2022 RESULTS
AND 2023 GUIDANCE
KEY HIGHLIGHTS
●
●
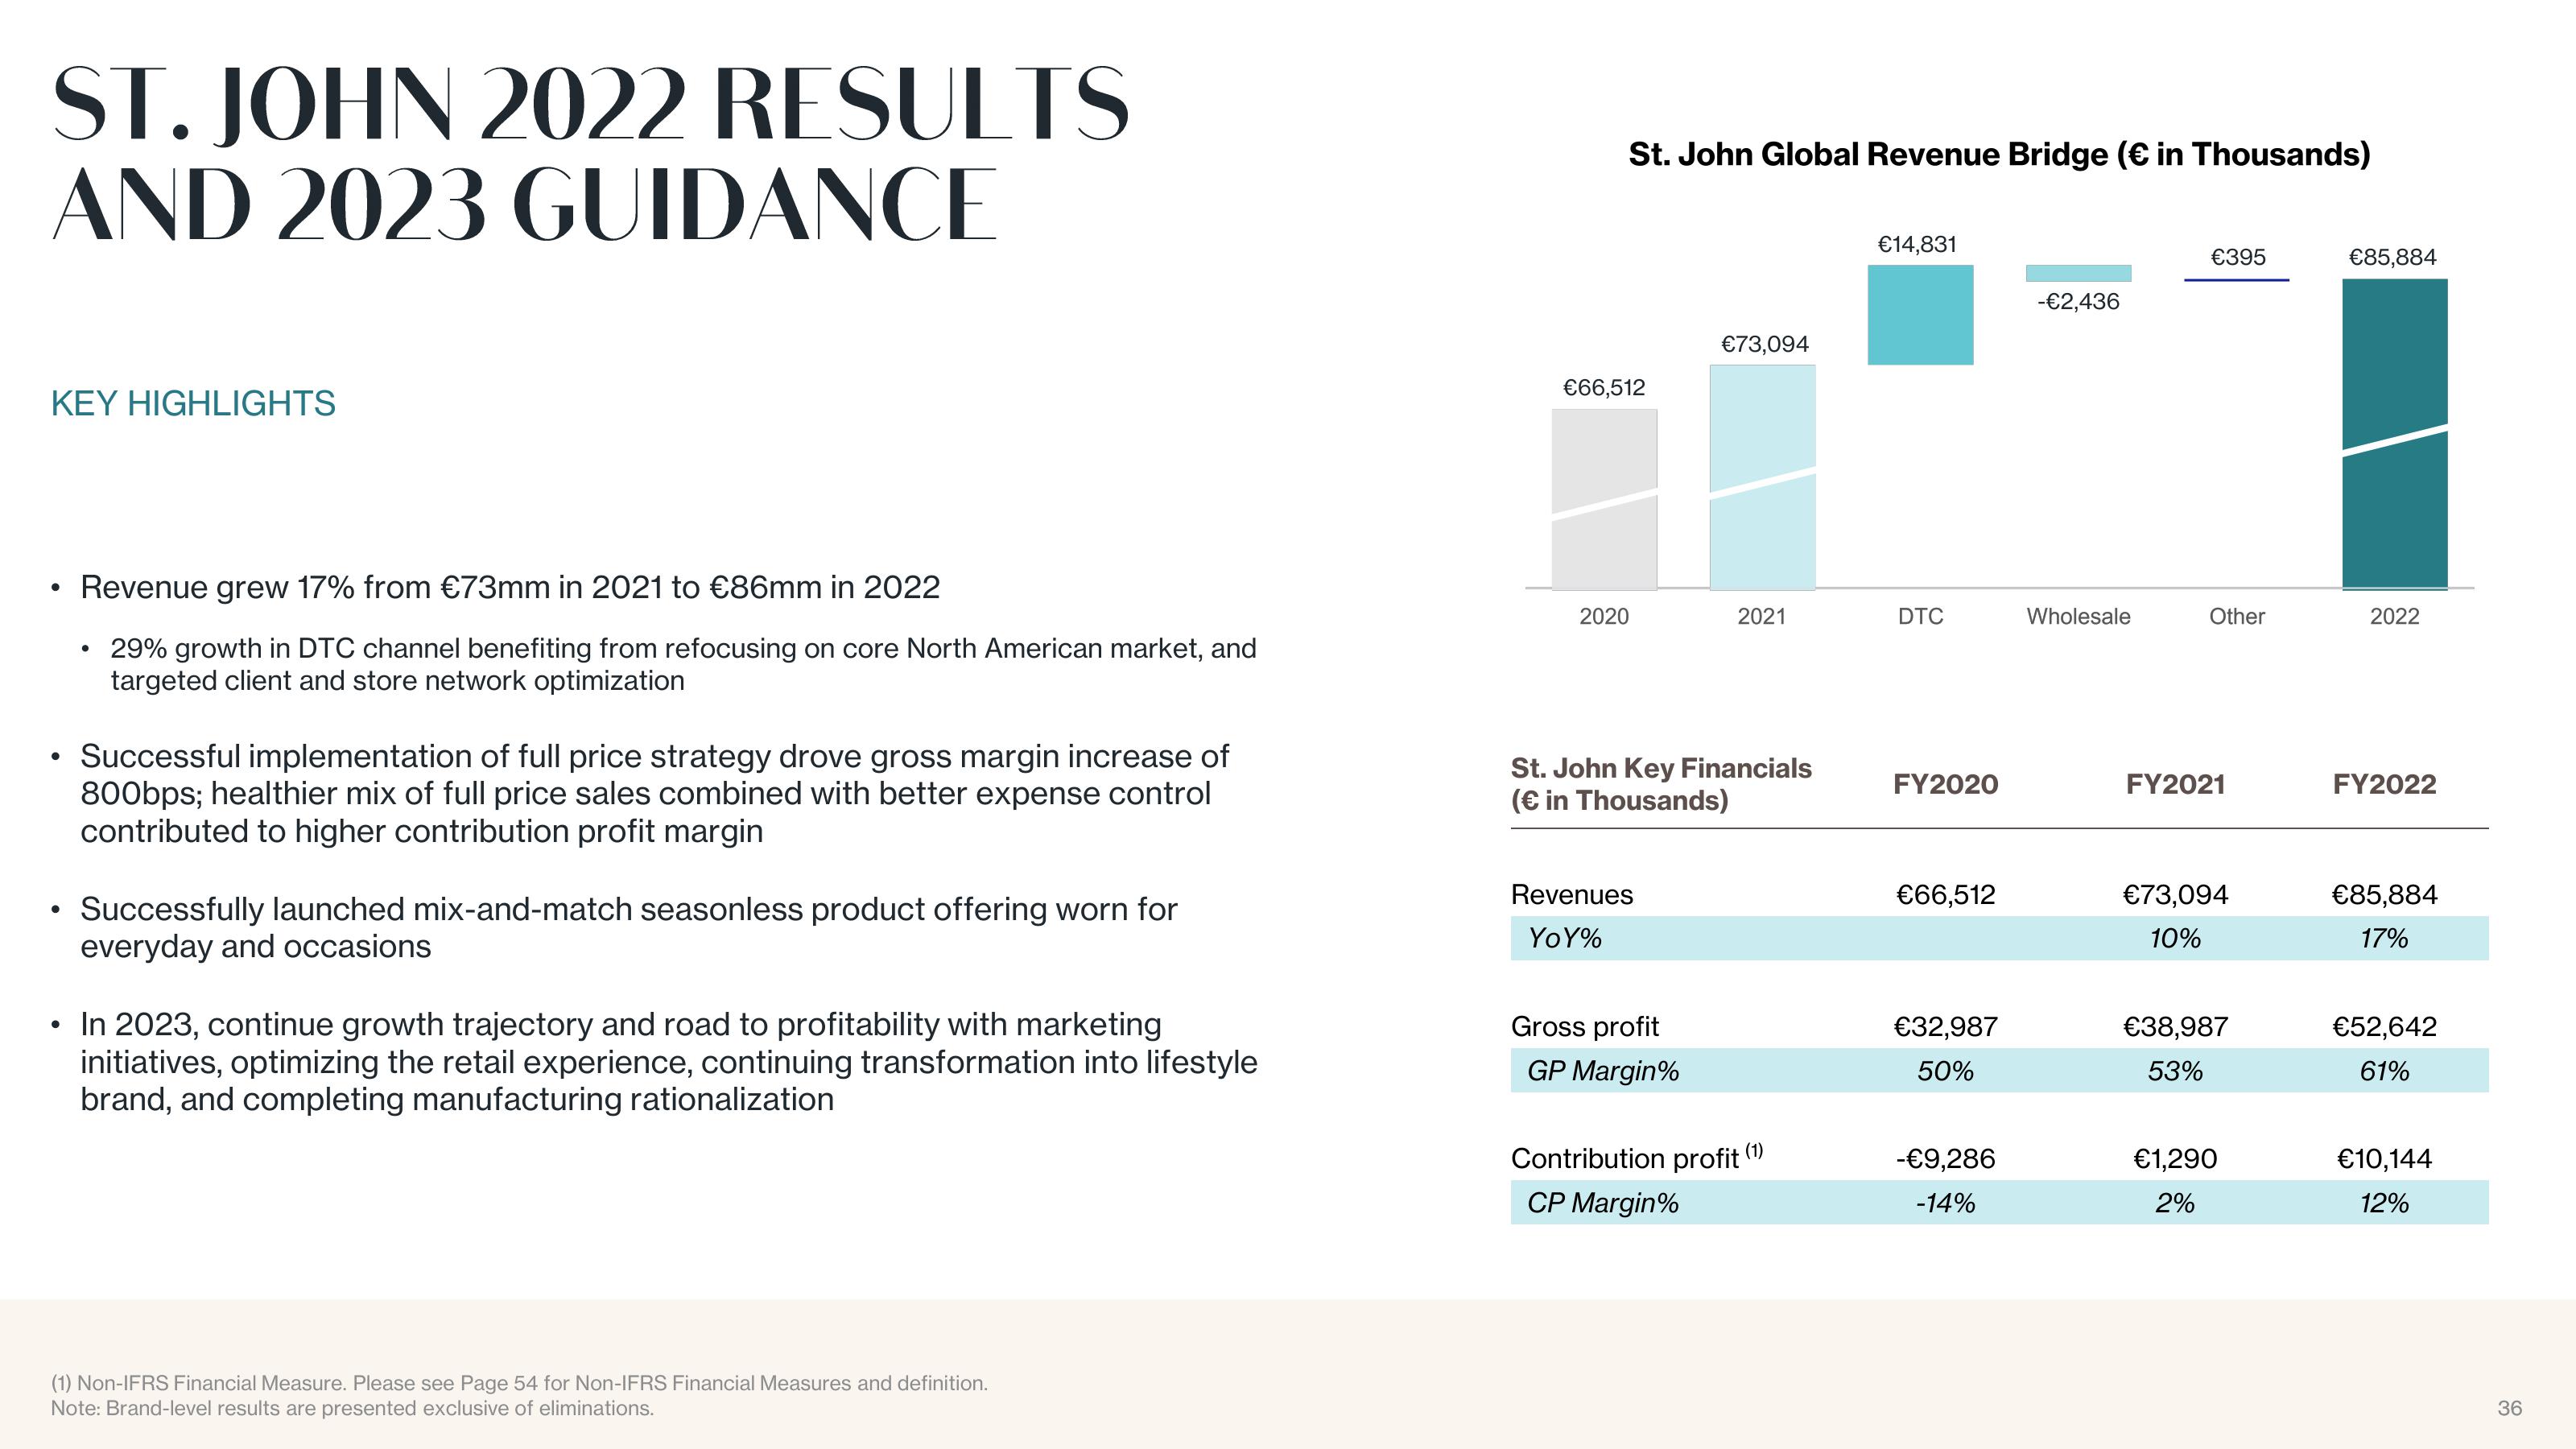
• Successful implementation of full price strategy drove gross margin increase of
800bps; healthier mix of full price sales combined with better expense control
contributed to higher contribution profit margin
●
Revenue grew 17% from €73mm in 2021 to €86mm in 2022
29% growth in DTC channel benefiting from refocusing on core North American market, and
targeted client and store network optimization
●
Successfully launched mix-and-match seasonless product offering worn for
everyday and occasions
In 2023, continue growth trajectory and road to profitability with marketing
initiatives, optimizing the retail experience, continuing transformation into lifestyle
brand, and completing manufacturing rationalization
(1) Non-IFRS Financial Measure. Please see Page 54 for Non-IFRS Financial Measures and definition.
Note: Brand-level results are presented exclusive of eliminations.
St. John Global Revenue Bridge (€ in Thousands)
€66,512
2020
Revenues
YoY%
St. John Key Financials
(€ in Thousands)
Gross profit
€73,094
GP Margin%
2021
Contribution profit (1)
CP Margin%
€14,831
DTC
FY2020
€66,512
€32,987
50%
-€9,286
-14%
-€2,436
Wholesale
€395
Other
FY2021
€73,094
10%
€38,987
53%
€1,290
2%
€85,884
2022
FY2022
€85,884
17%
€52,642
61%
€10,144
12%
36View entire presentation