Kinnevik Results Presentation Deck
Intro
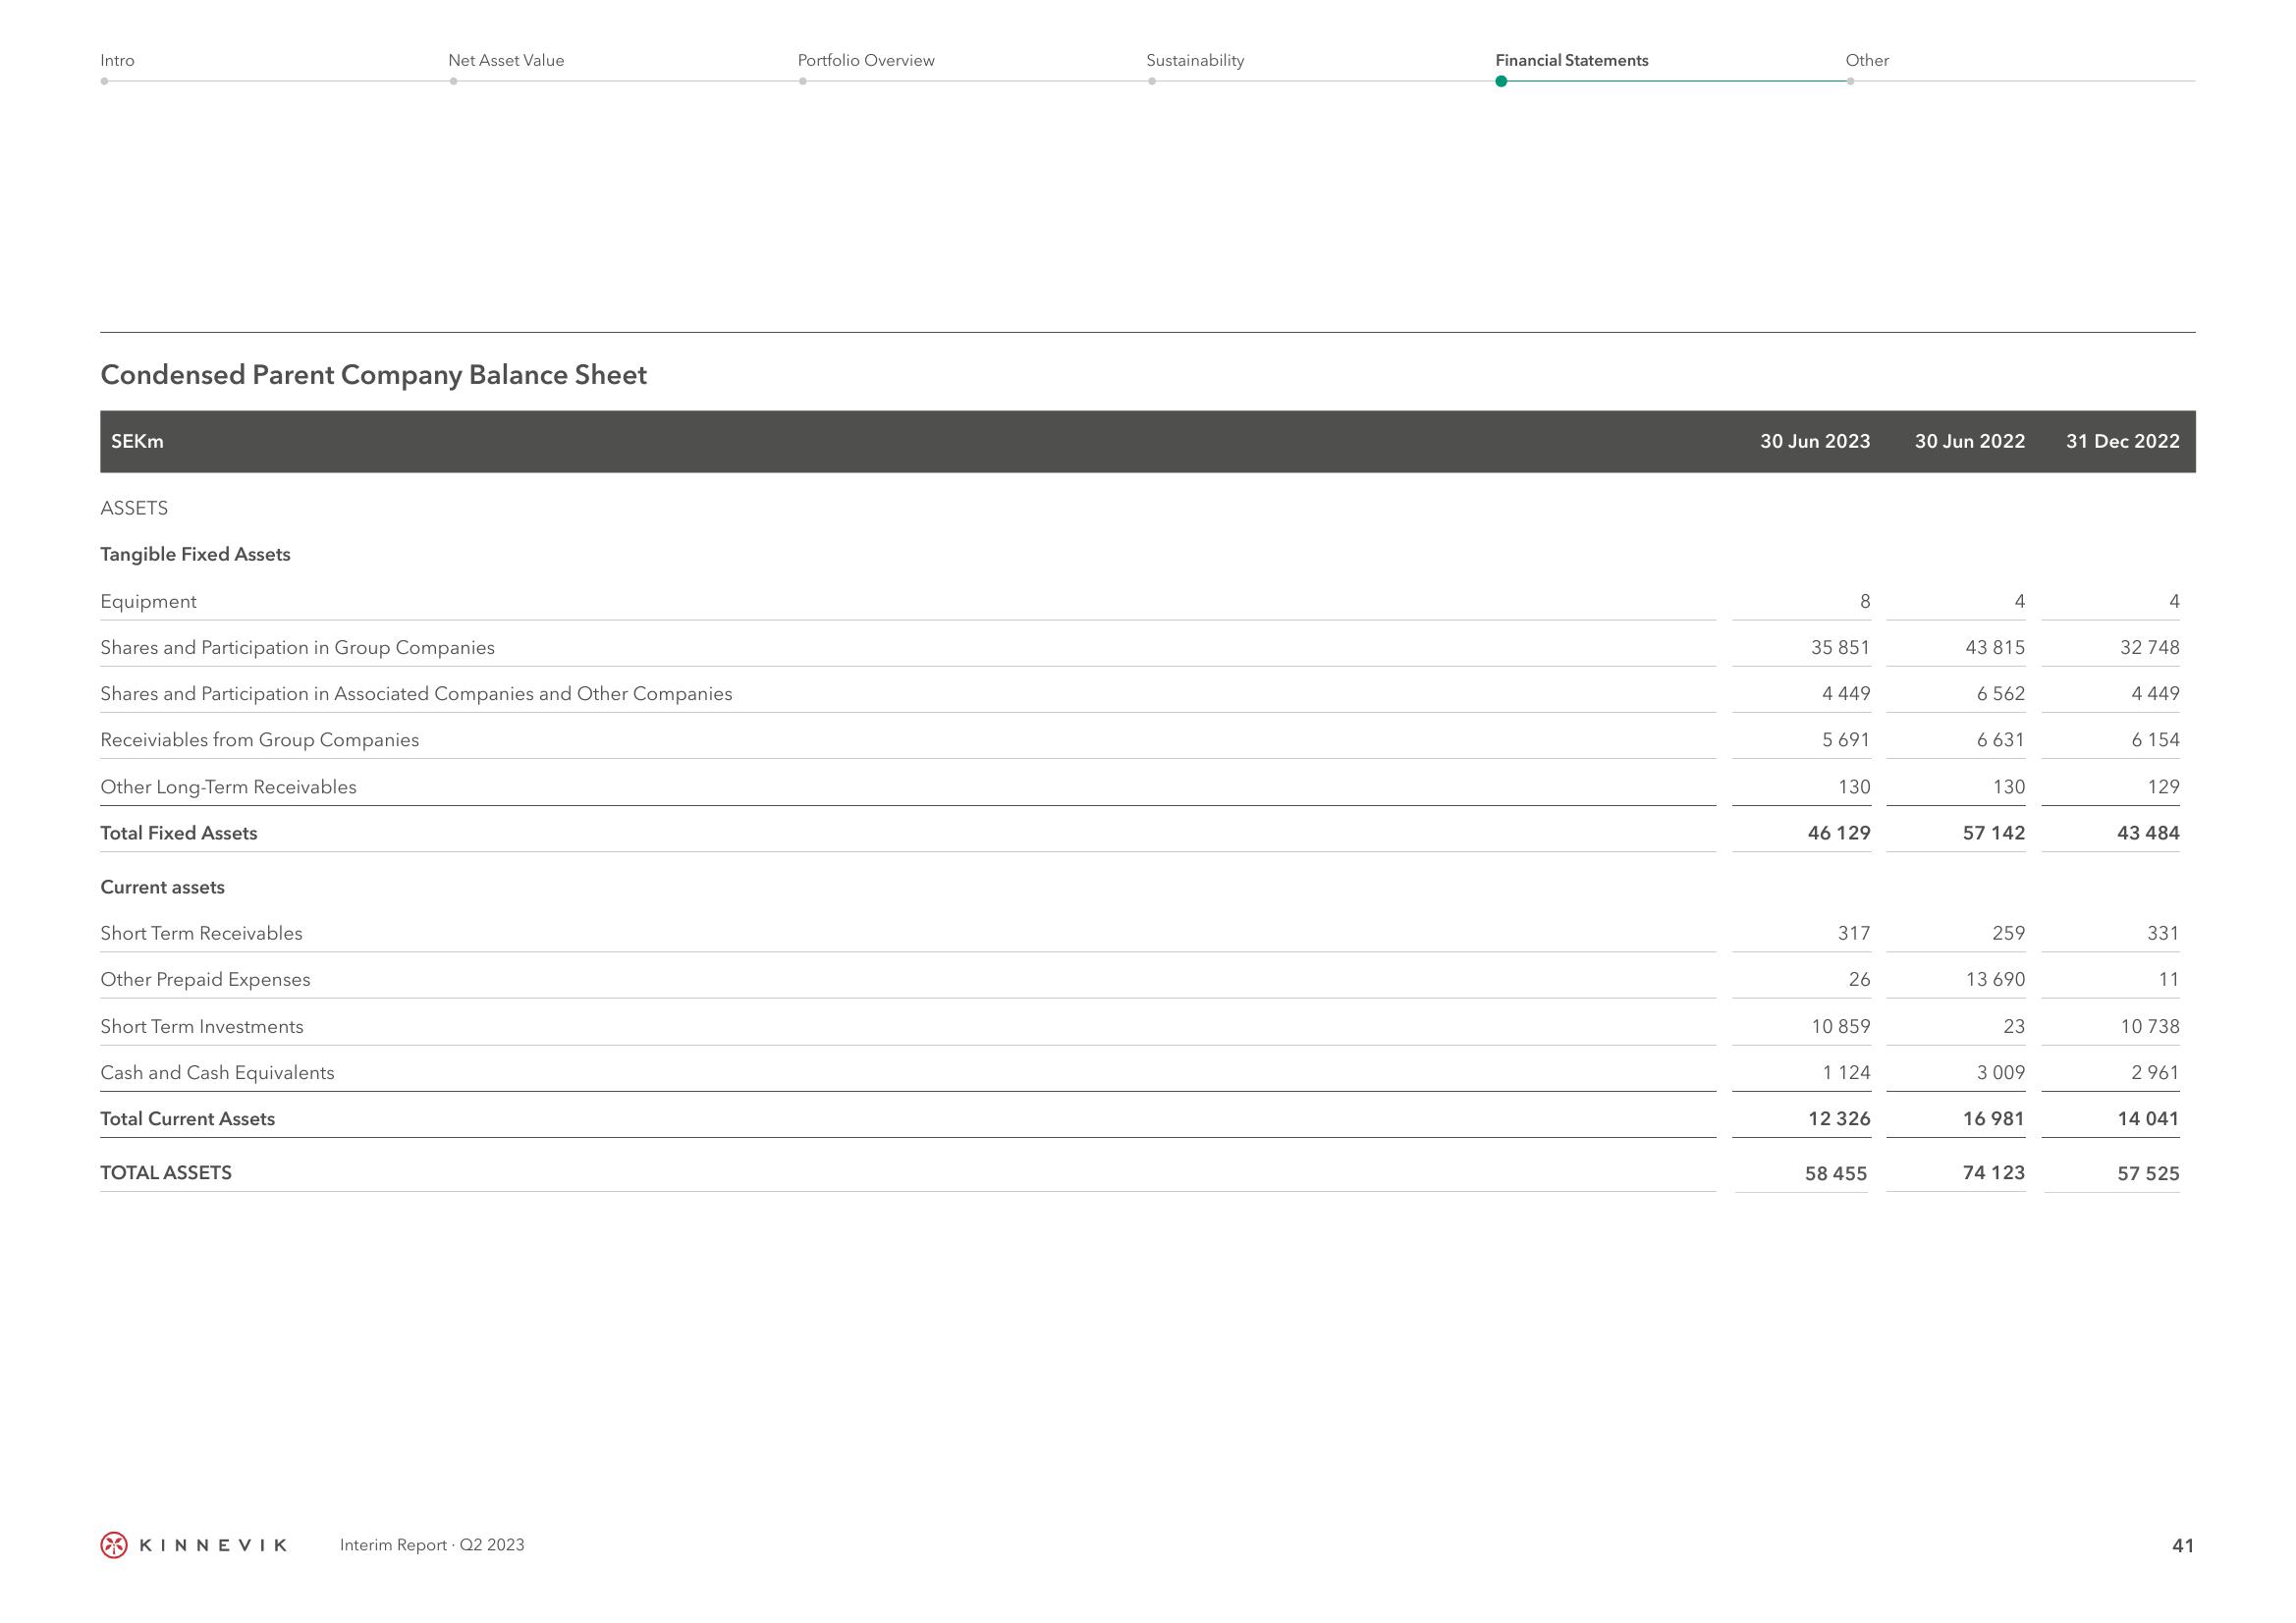
Condensed Parent Company Balance Sheet
SEKM
ASSETS
Tangible Fixed Assets
Equipment
Shares and Participation in Group Companies
Shares and Participation in Associated Companies and Other Companies
Receiviables from Group Companies
Other Long-Term Receivables
Total Fixed Assets
Current assets
Short Term Receivables
Other Prepaid Expenses
Short Term Investments
Cash and Cash Equivalents
Total Current Assets
Net Asset Value
TOTAL ASSETS
KINNEVIK
Interim Report Q2 2023
Portfolio Overview
Sustainability
Financial Statements
Other
30 Jun 2023
8
35 851
4 449
5 691
130
46 129
317
26
10 859
1124
12 326
58 455
30 Jun 2022
4
43 815
6 562
6 631
130
57 142
259
13 690
23
3 009
16 981
74 123
31 Dec 2022
4
32 748
4 449
6 154
129
43 484
331
11
10 738
2961
14 041
57 525
41View entire presentation