Shift SPAC Presentation Deck
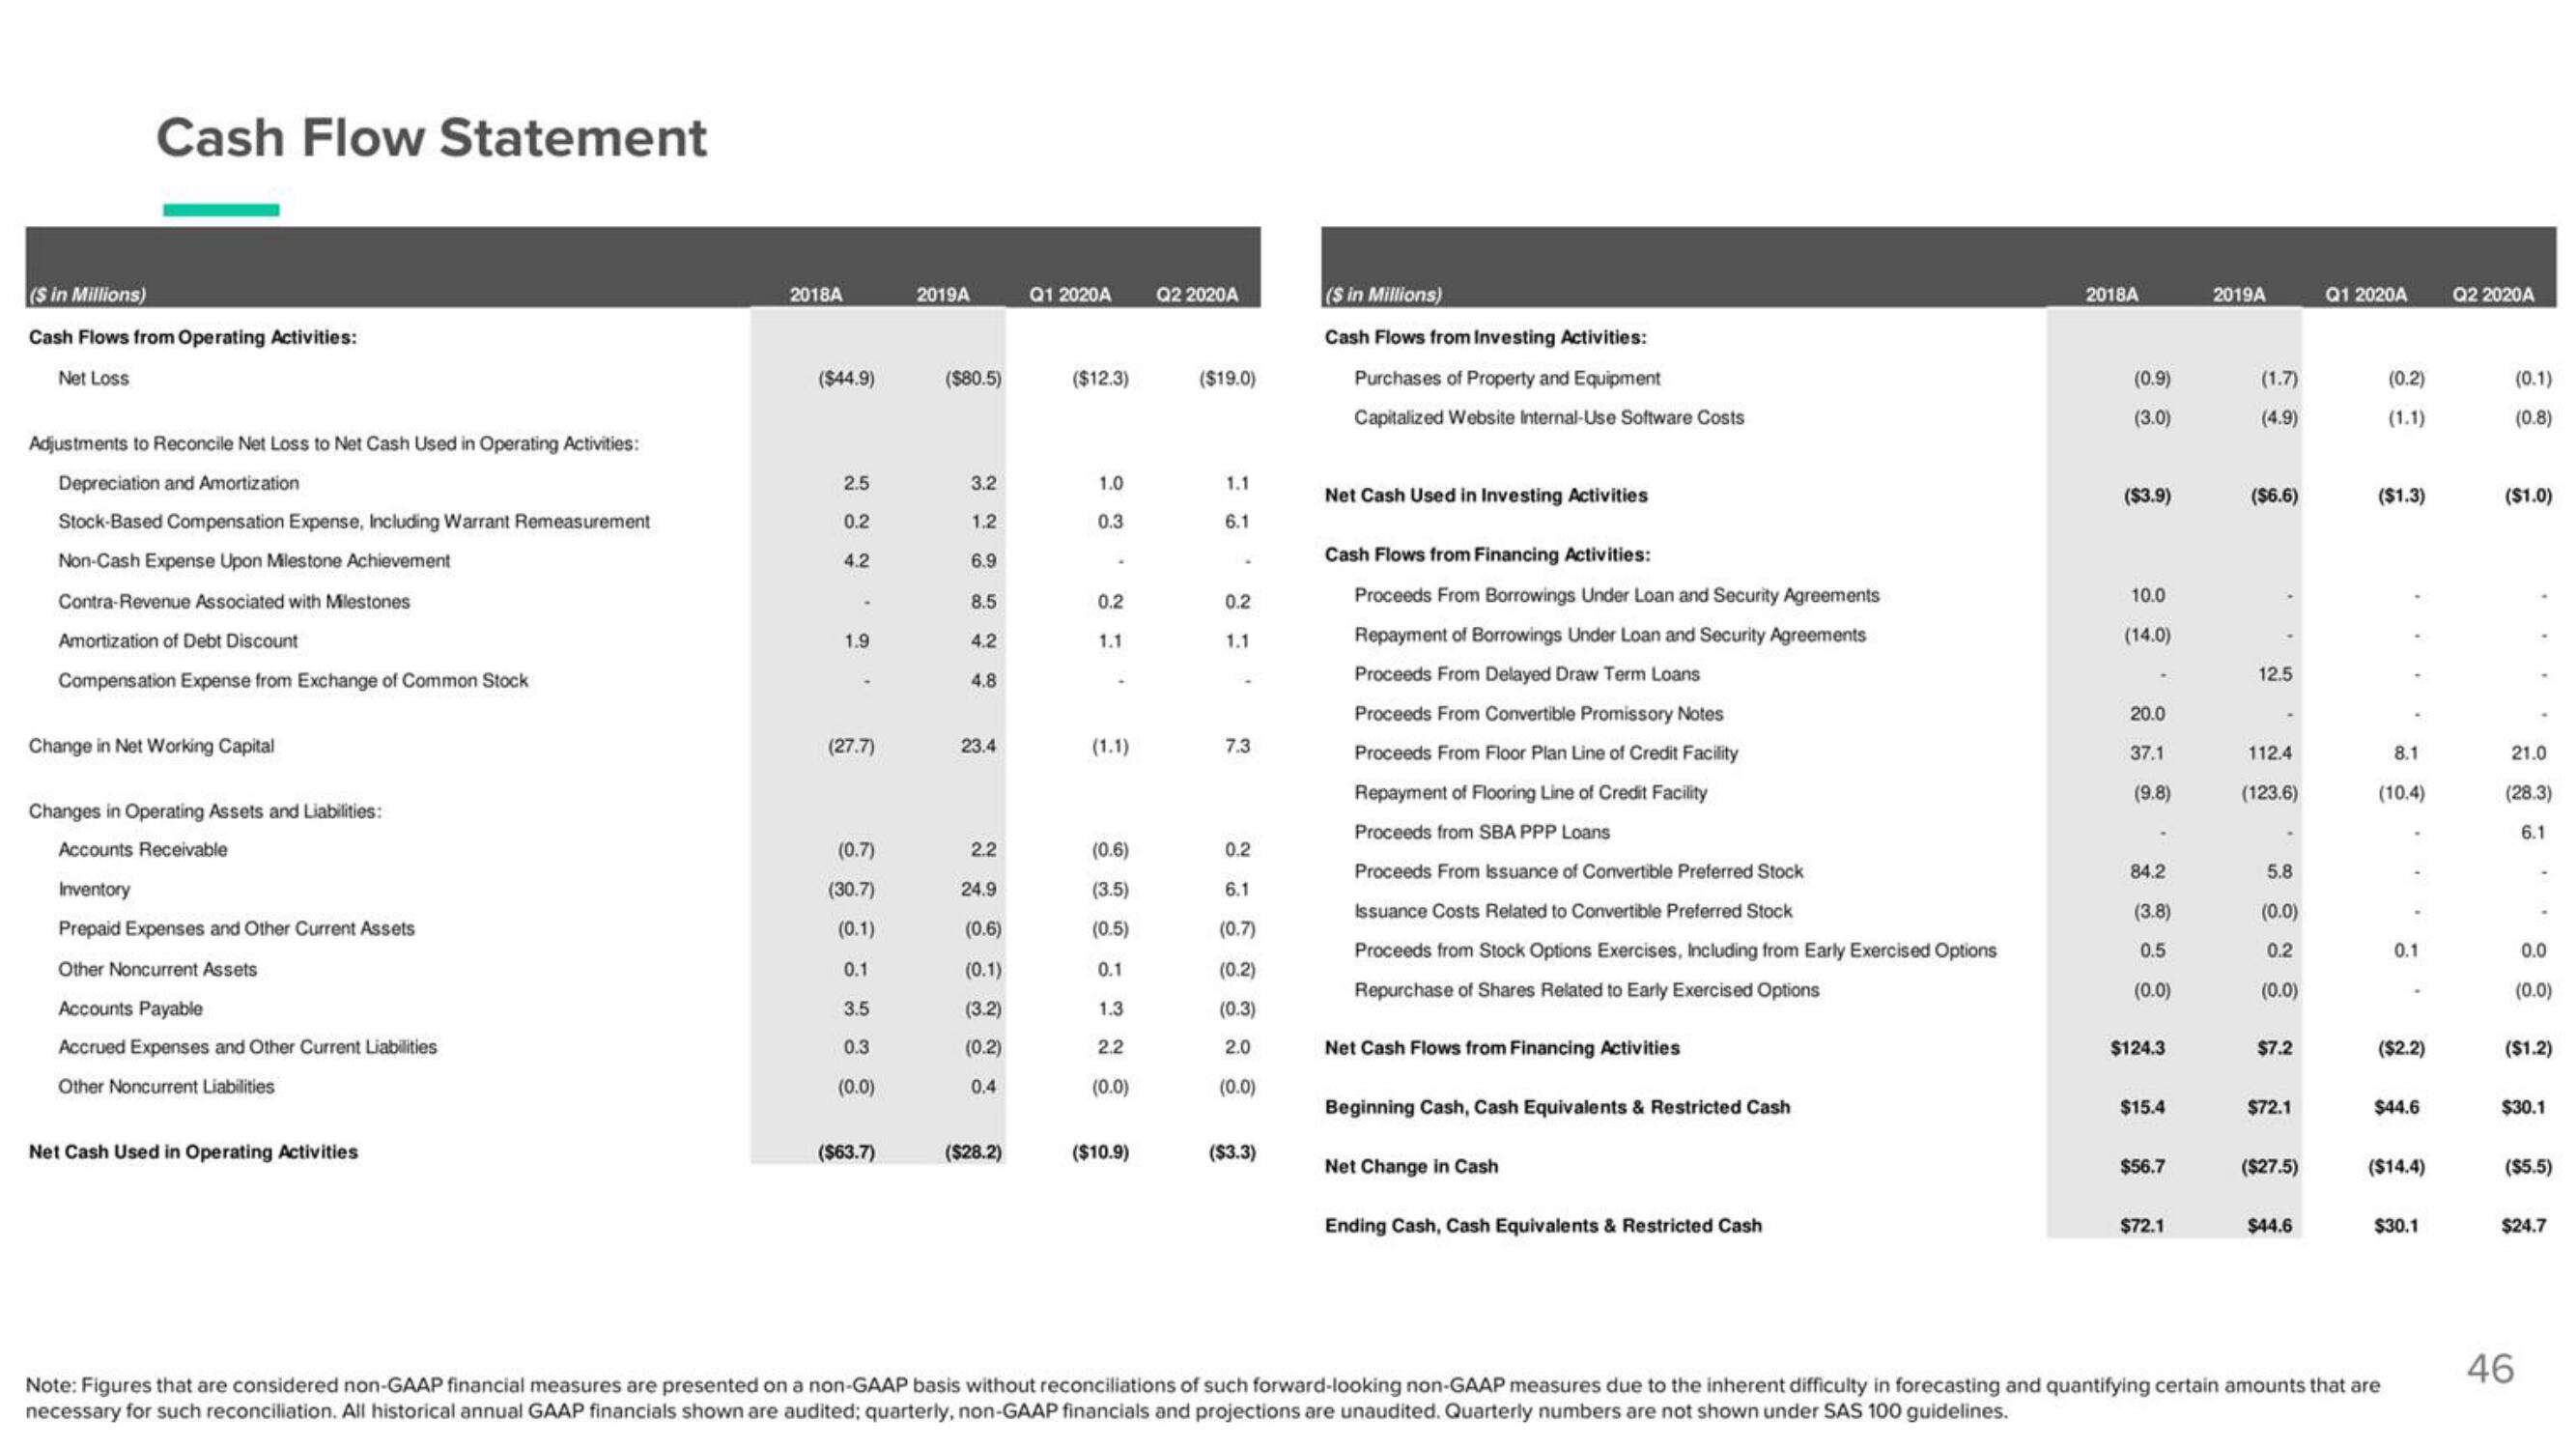
Cash Flow Statement
(S in Millions)
Cash Flows from Operating Activities:
Net Loss
Adjustments to Reconcile Net Loss to Net Cash Used in Operating Activities:
Depreciation and Amortization
Stock-Based Compensation Expense, Including Warrant Remeasurement
Non-Cash Expense Upon Milestone Achievement
Contra-Revenue Associated with Milestones
Amortization of Debt Discount
Compensation Expense from Exchange of Common Stock
Change in Net Working Capital
Changes in Operating Assets and Liabilities:
Accounts Receivable
Inventory
Prepaid Expenses and Other Current Assets
Other Noncurrent Assets
Accounts Payable
Accrued Expenses and Other Current Liabilities
Other Noncurrent Liabilities
Net Cash Used in Operating Activities
2018A
($44.9)
2.5
0.2
4.2
1.9
(27.7)
(0.7)
(30.7)
(0.1)
0.1
3.5
0.3
(0.0)
($63.7)
2019A
($80.5)
3.2
1.2
6.9
8.5
4.2
4.8
23.4
2.2
24.9
(0.6)
(0.1)
(3.2)
(0.2)
0.4
($28.2)
Q1 2020A
($12.3)
1.0
0.3
0.2
1.1
(1.1)
(0.6)
(3.5)
(0.5)
0.1
1.3
2.2
(0.0)
($10.9)
Q2 2020A
($19.0)
1.1
6.1
0.2
1.1
7.3
0.2
6.1
(0.7)
(0.2)
(0.3)
2.0
(0.0)
($3.3)
($ in Millions)
Cash Flows from Investing Activities:
Purchases of Property and Equipment
Capitalized Website Internal-Use Software Costs
Net Cash Used in Investing Activities
Cash Flows from Financing Activities:
Proceeds From Borrowings Under Loan and Security Agreements
Repayment of Borrowings Under Loan and Security Agreements
Proceeds From Delayed Draw Term Loans
Proceeds From Convertible Promissory Notes
Proceeds From Floor Plan Line of Credit Facility
Repayment of Flooring Line of Credit Facility
Proceeds from SBA PPP Loans
Proceeds From Issuance of Convertible Preferred Stock
Issuance Costs Related to Convertible Preferred Stock
Proceeds from Stock Options Exercises, Including from Early Exercised Options
Repurchase of Shares Related to Early Exercised Options
Net Cash Flows from Financing Activities
Beginning Cash, Cash Equivalents & Restricted Cash
Net Change in Cash
Ending Cash, Cash Equivalents & Restricted Cash
2018A
(0.9)
(3.0)
($3.9)
10.0
(14.0)
20.0
37.1
(9.8)
84.2
(3.8)
0.5
(0.0)
$124.3
$15.4
$56.7
$72.1
2019A
(1.7)
(4.9)
($6.6)
12.5
112.4
(123.6)
5.8
(0.0)
0.2
(0.0)
$7.2
$72.1
($27.5)
$44.6
Q1 2020A
(0.2)
(1.1)
($1.3)
8.1
(10.4)
0.1
($2.2)
$44.6
Note: Figures that are considered non-GAAP financial measures are presented on a non-GAAP basis without reconciliations of such forward-looking non-GAAP measures due to the inherent difficulty in forecasting and quantifying certain amounts that are
necessary for such reconciliation. All historical annual GAAP financials shown are audited; quarterly, non-GAAP financials and projections are unaudited. Quarterly numbers are not shown under SAS 100 guidelines.
($14.4)
$30.1
Q2 2020A
(0.1)
(0.8)
($1.0)
21.0
(28.3)
6.1
0.0
(0.0)
($1.2)
$30.1
($5.5)
$24.7
46View entire presentation