Bank of America Investment Banking Pitch Book
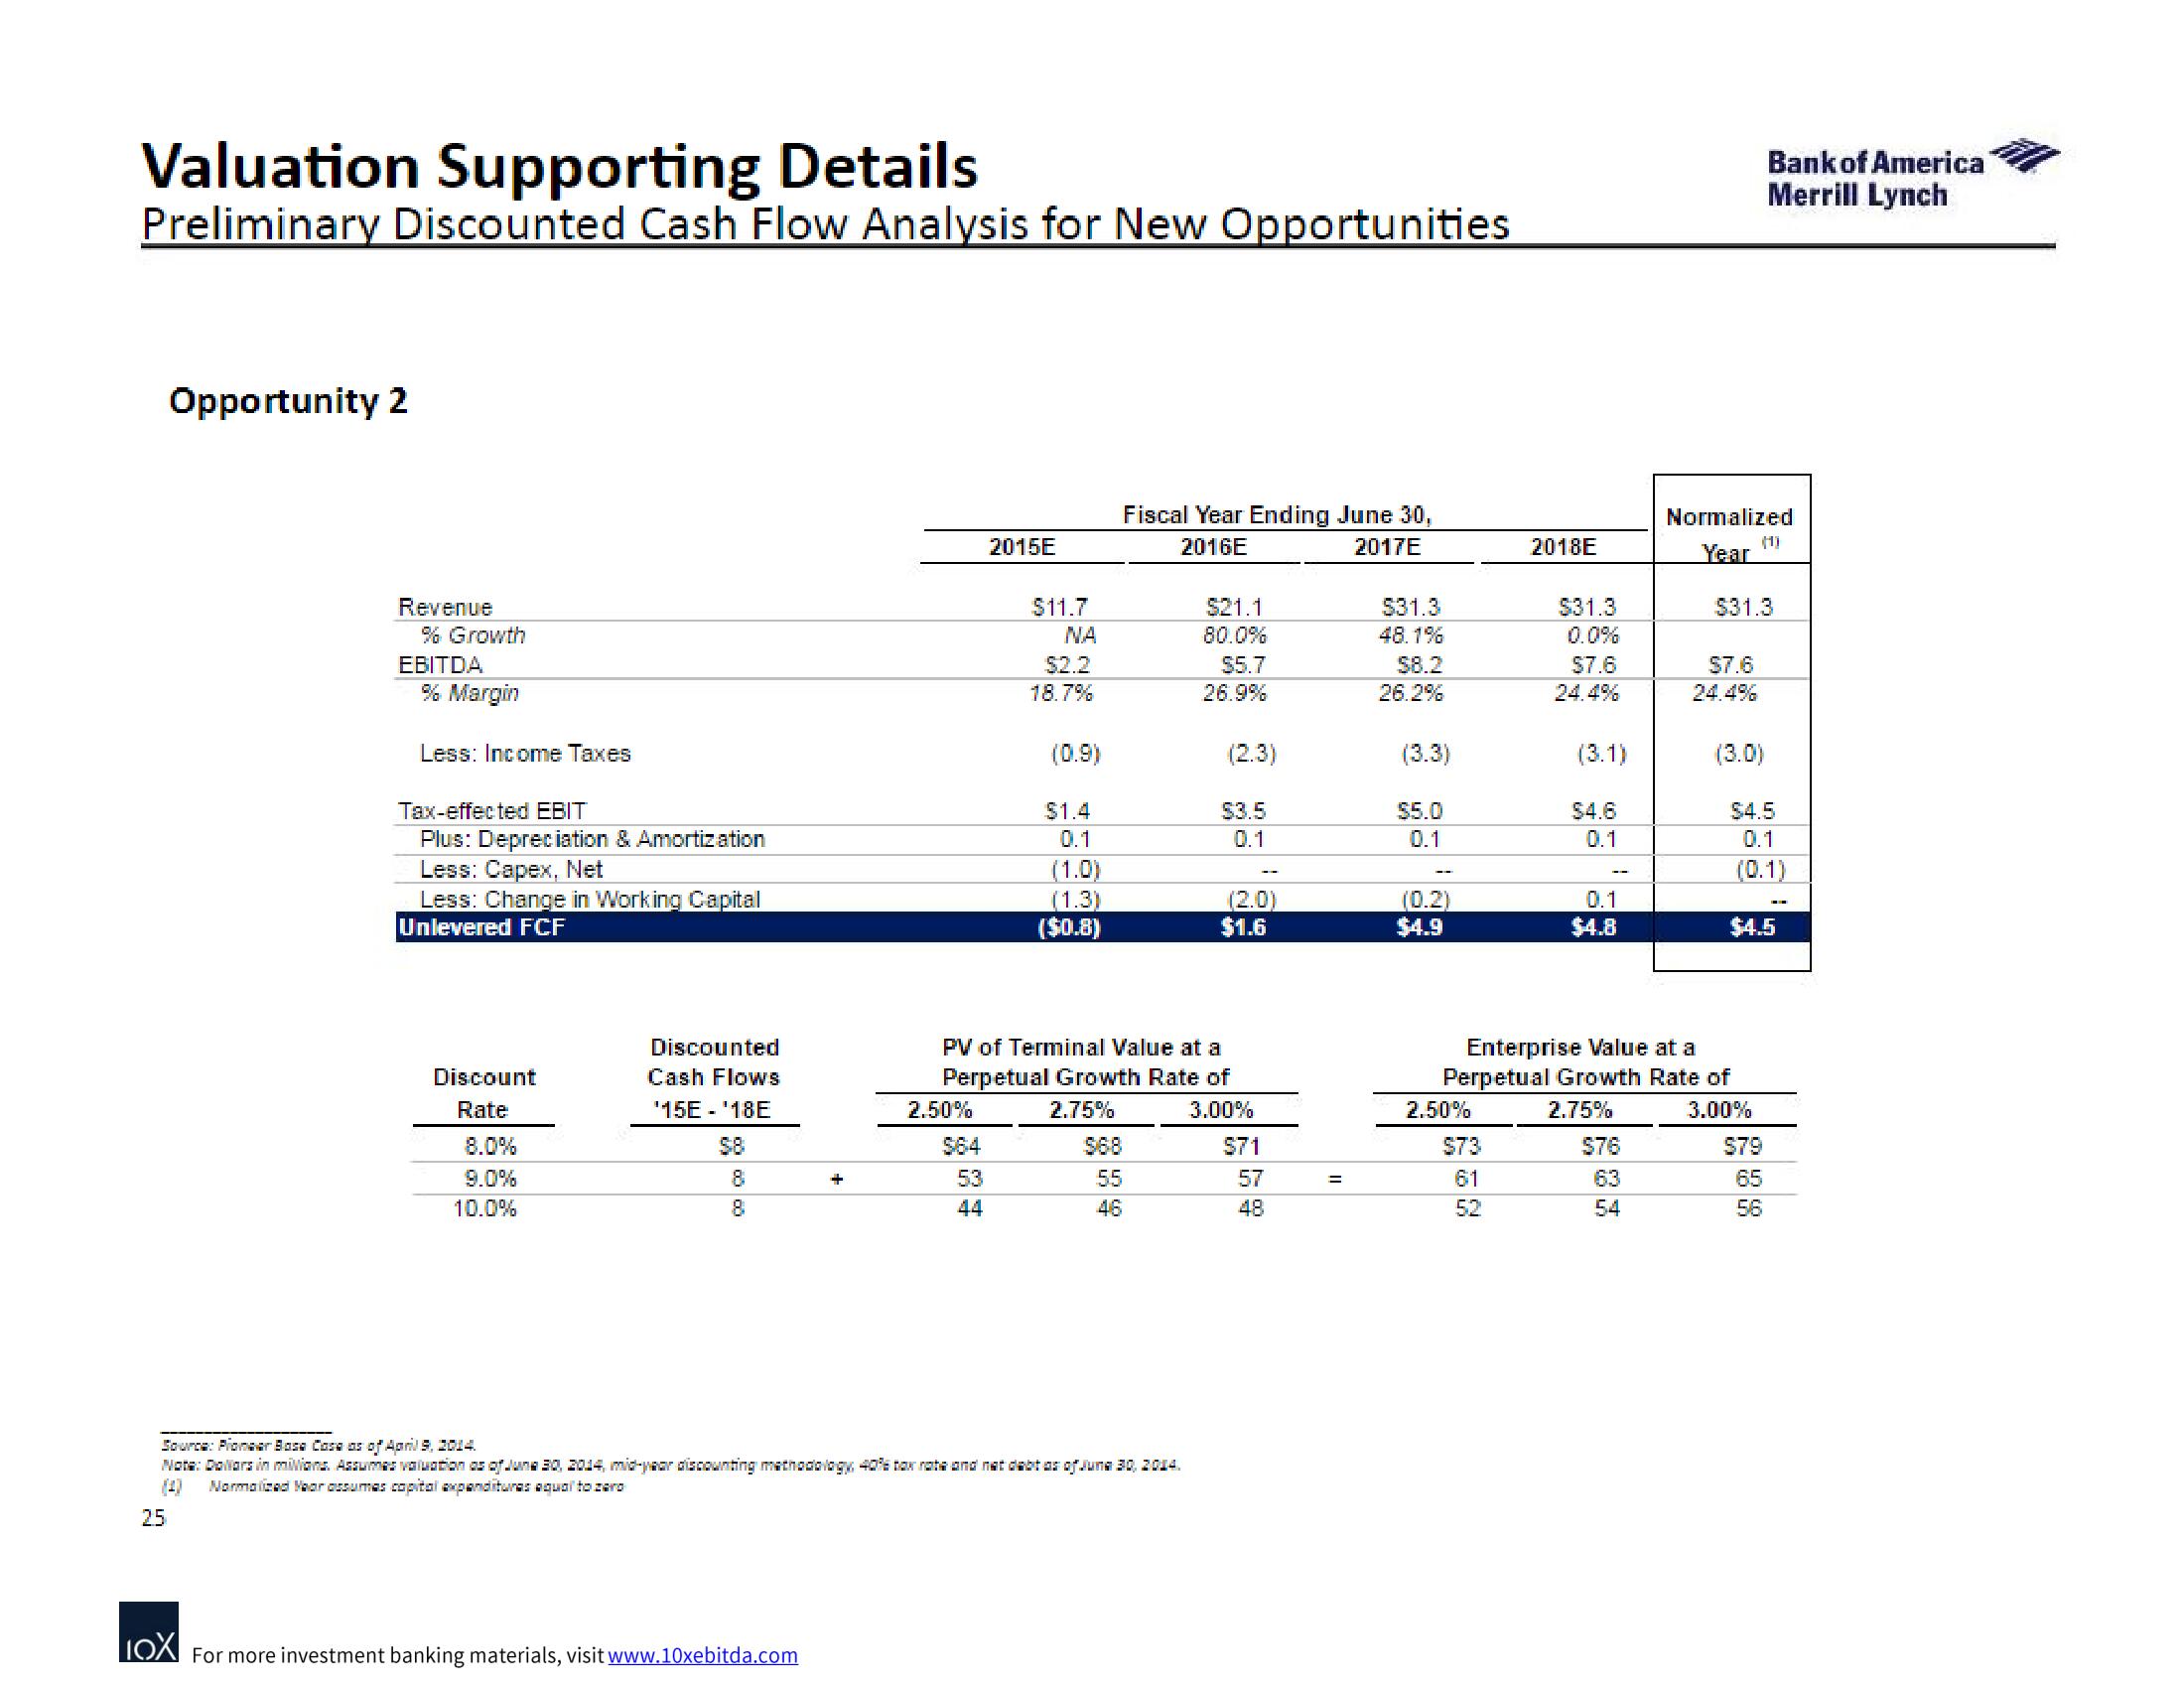
Valuation Supporting Details
Preliminary Discounted Cash Flow Analysis for New Opportunities
Opportunity 2
Revenue
% Growth
EBITDA
% Margin
Less: Income Taxes
Tax-effected EBIT
Plus: Depreciation & Amortization
Less: Capex, Net
Less: Change in Working Capital
Unlevered FCF
Discount
Rate
9.0%
10.0%
Discounted
Cash Flows
¹15E - ¹18E
8
+
LOX For more investment banking materials, visit www.10xebitda.com
2.50%
2015E
53
44
$11.7
NA
$2.2
18.7%
(0.9)
$1.4
0.1
(1.0)
(1.3)
($0.8)
Fiscal Year Ending June 30,
2016E
2017E
5.5
46
Source: Pioneer Bose Cose as of April 9, 2014.
Nota: Dollars in milions. Assumes valuation as of June 30, 2014, mid-year discounting methodology, 40% tax rate and nat debt as of June 30, 2014.
(4) Normalized Year assumes capital expenditures equal to zero
25
$21.1
80.0%
$5.7
26.9%
PV of Terminal Value at a
Perpetual Growth Rate of
2.75%
3.00%
(2.3)
$3.5
0.1
$1.6
$71
57
48
$31.3
48.1%
58.2
26.2%
(3.3)
$5.0
0.1
$4.9
2.50%
2018E
$73
61
5.2
$31.3
$7.6
24.4%
(3.1)
$4.6
0.1
0.1
$4.8
576
63
54
Normalized
Year
$7.6
24.4%
$31.3
Enterprise Value at a
Perpetual Growth Rate of
2.75%
3.00%
Bank of America
Merrill Lynch
(1)
(3.0)
$4.5
0.1
(0.1)
$4.5
$79
65
56View entire presentation