First Merchants Results Presentation Deck
Nonperforming Assets
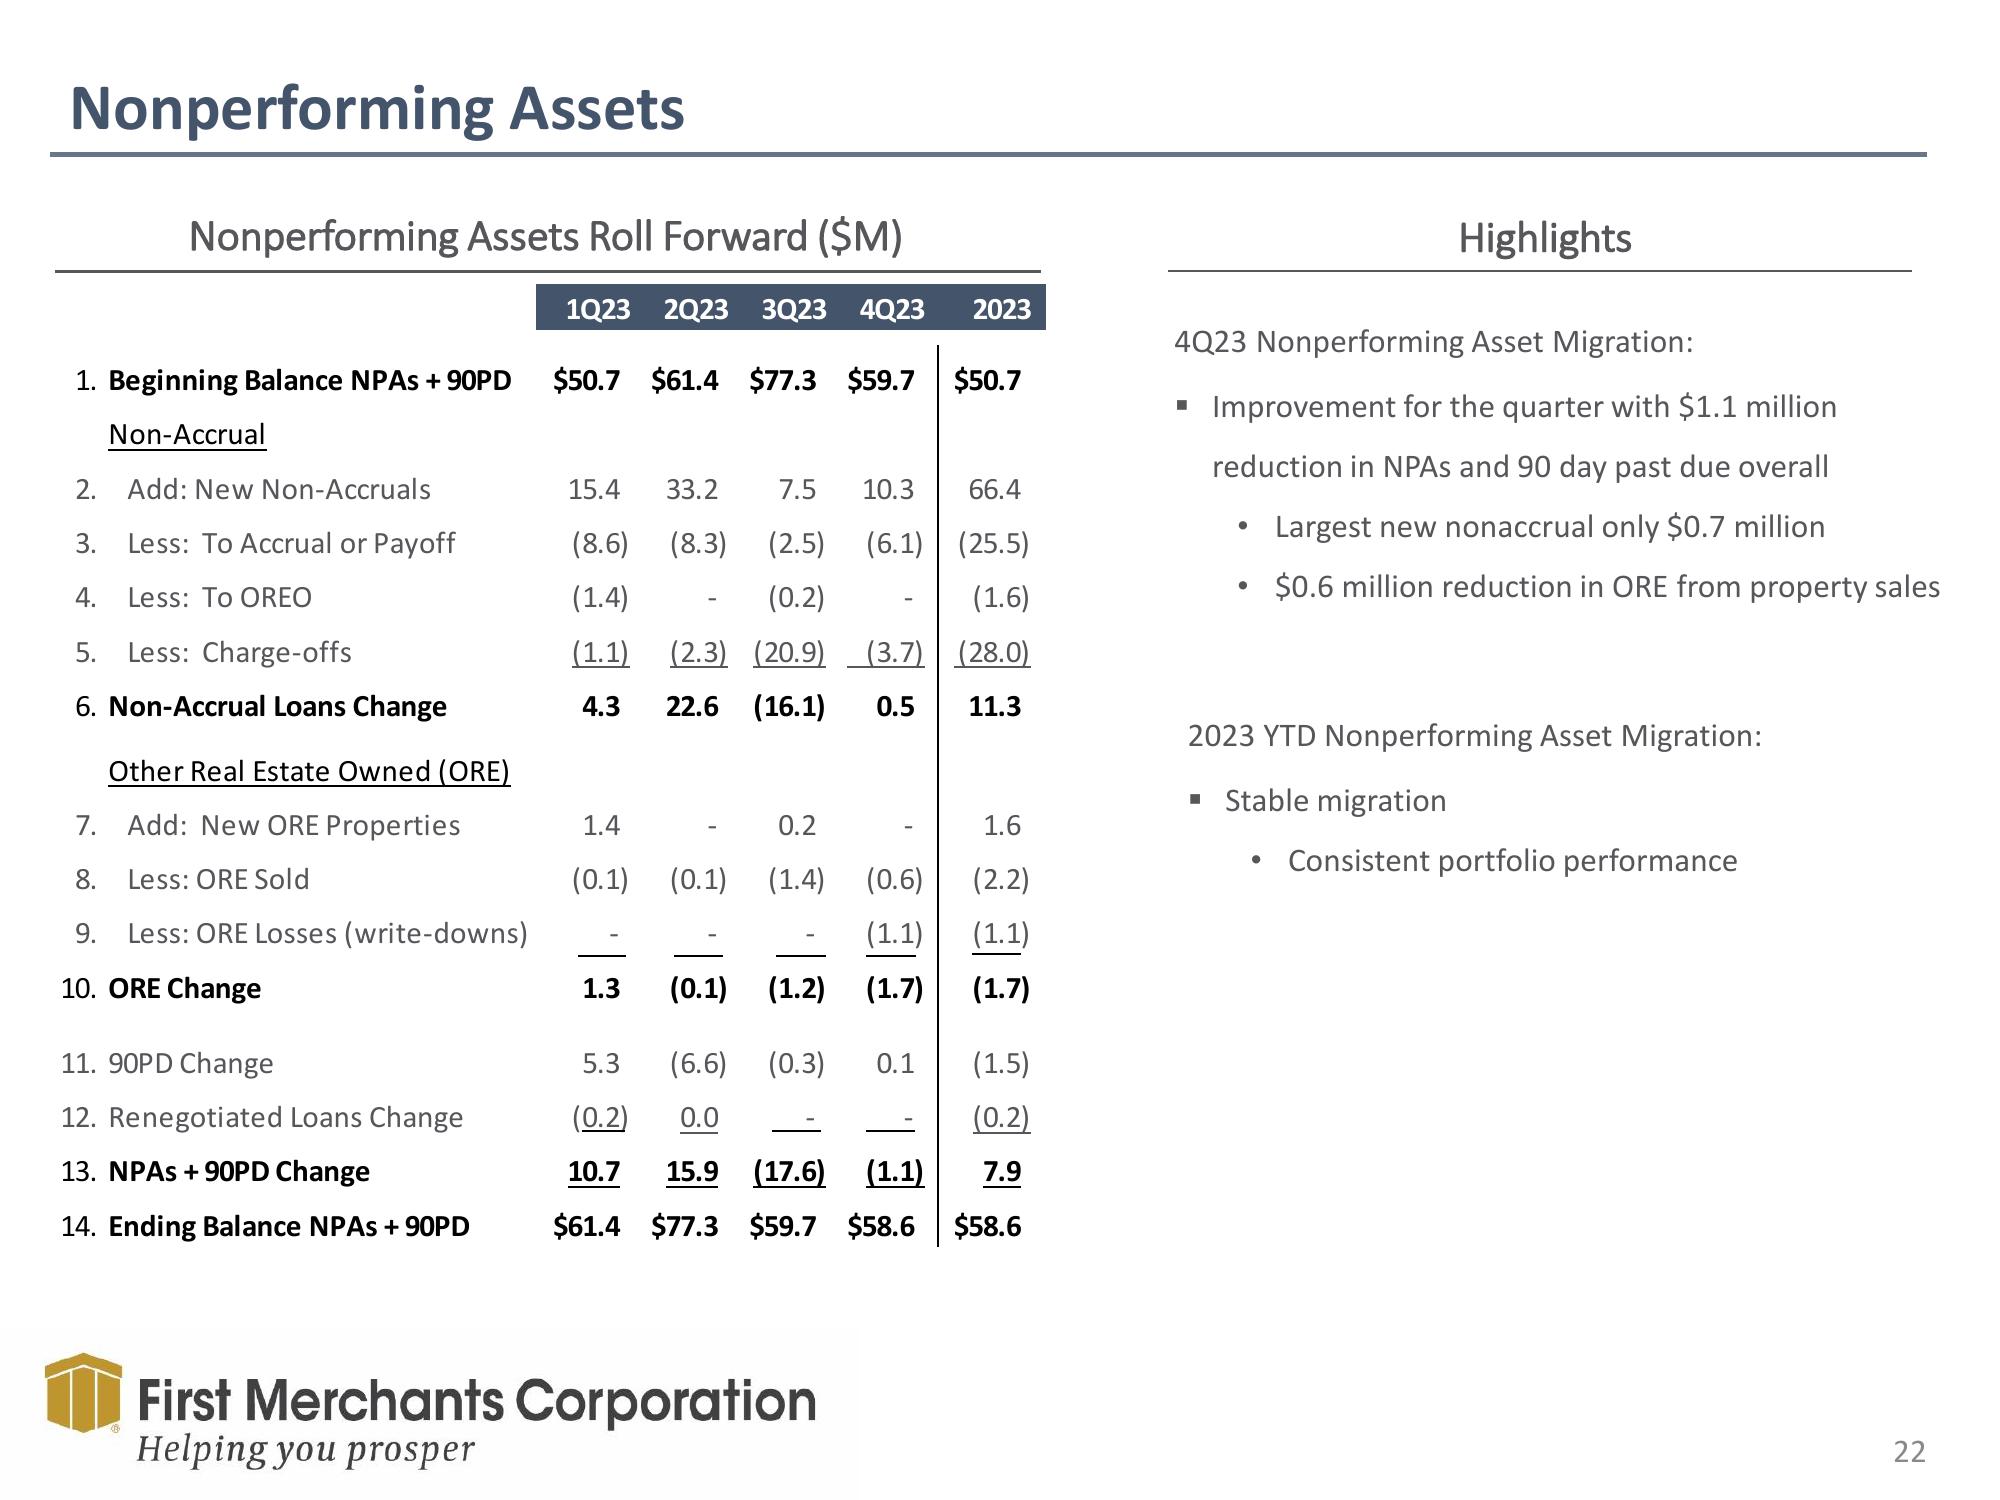
Nonperforming Assets Roll Forward ($M)
1. Beginning Balance NPAs +90PD
Non-Accrual
2. Add: New Non-Accruals
3.
Less: To Accrual or Payoff
4. Less: To OREO
5. Less: Charge-offs
6. Non-Accrual Loans Change
Other Real Estate Owned (ORE)
7. Add: New ORE Properties
8.
Less: ORE Sold
9. Less: ORE Losses (write-downs)
10. ORE Change
11. 90PD Change
12. Renegotiated Loans Change
13. NPAS +90PD Change
14. Ending Balance NPAS + 90PD
1Q23 2Q23 3Q23 4Q23 2023
$50.7 $61.4 $77.3 $59.7 $50.7
15.4
33.2 7.5 10.3 66.4
(8.6) (8.3) (2.5) (6.1) (25.5)
(0.2)
(1.4)
(1.6)
(1.1)
(2.3) (20.9) (3.7)| (28.0)
4.3
22.6 (16.1) 0.5 11.3
1.4
0.2
(0.1) (0.1) (1.4)
1.3
(0.6)
(1.1)
(0.1) (1.2) (1.7)
(6.6) (0.3) 0.1
0.0
1.6
(2.2)
(1.1)
(1.7)
First Merchants Corporation
Helping you prosper
5.3
(0.2)
10.7 15.9 (17.6) (1.1)
$61.4 $77.3 $59.7 $58.6 $58.6
(1.5)
(0.2)
7.9
Highlights
4Q23 Nonperforming Asset Migration:
■ Improvement for the quarter with $1.1 million
reduction in NPAs and 90 day past due overall
Largest new nonaccrual only $0.7 million
• $0.6 million reduction in ORE from property sales
●
2023 YTD Nonperforming Asset Migration:
▪ Stable migration
Consistent portfolio performance
22View entire presentation