DraftKings Results Presentation Deck
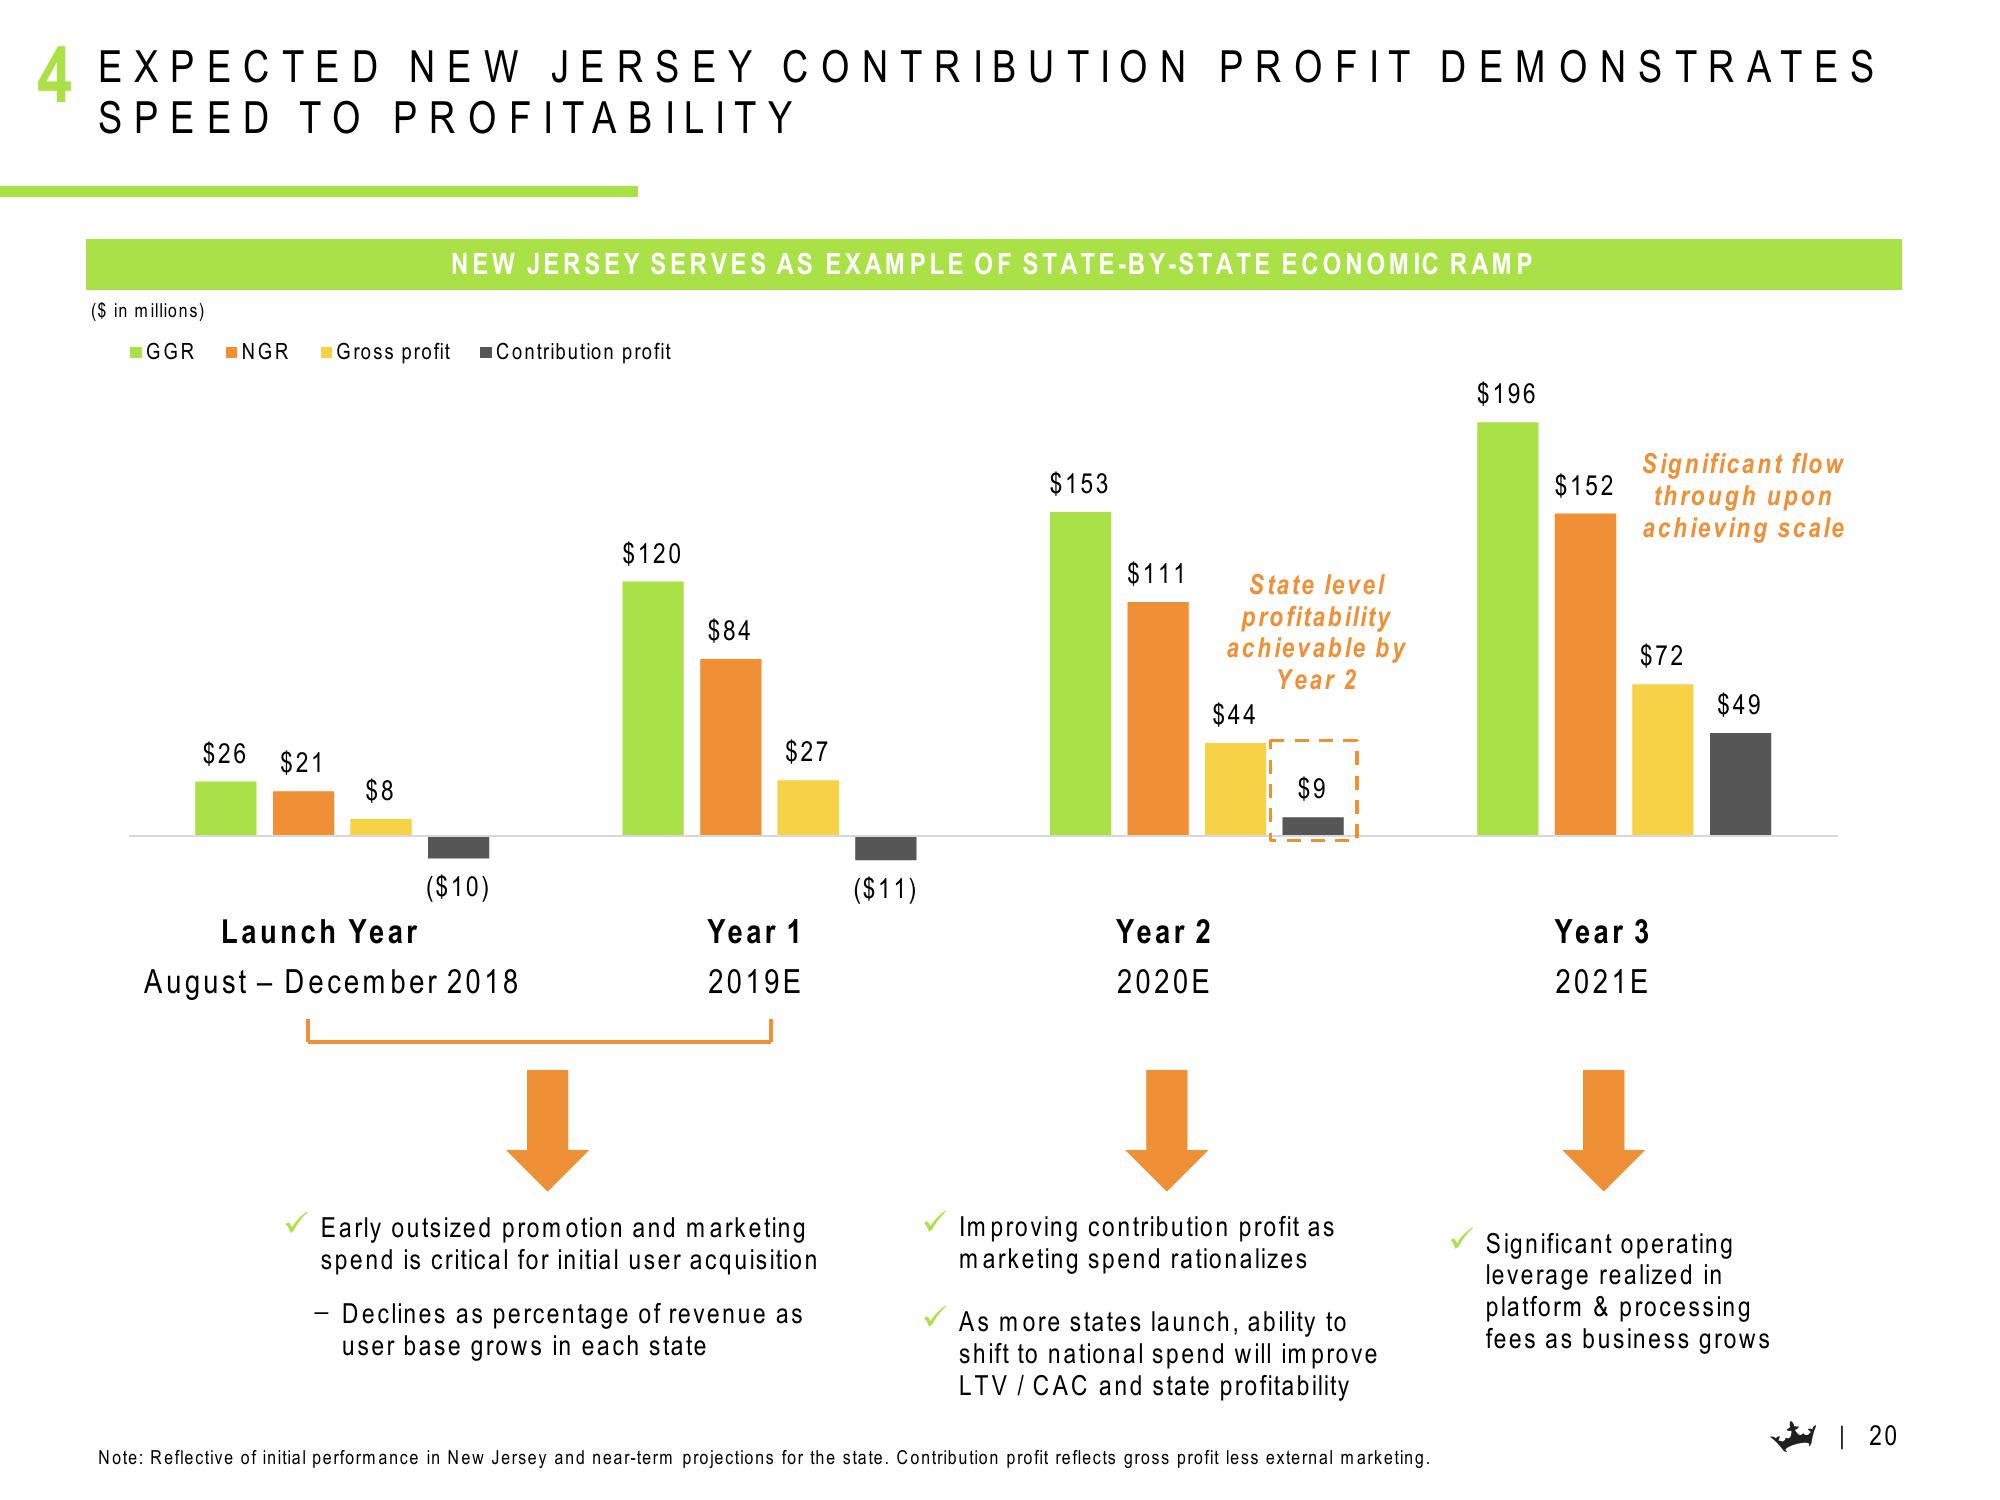
4 EXPECTED NEW JERSEY CONTRIBUTION PROFIT DEMONSTRATES
SPEED TO PROFITABILITY
($ in millions)
GGR NGR Gross profit
$26 $21
NEW JERSEY SERVES AS EXAMPLE OF STATE-BY-STATE ECONOMIC RAMP
$8
($10)
Contribution profit
Launch Year
August December 2018
$120
$84
$27
Year 1
2019E
Early outsized promotion and marketing
spend is critical for initial user acquisition
- Declines as percentage of revenue as
user base grows in each state
($11)
$153
$111
Year 2
2020E
State level
profitability
achievable by
Year 2
$44
$9
Improving contribution profit as
marketing spend rationalizes
As more states launch, ability to
shift to national spend will improve
LTV / CAC and state profitability
Note: Reflective of initial performance in New Jersey and near-term projections for the state. Contribution profit reflects gross profit less external marketing.
$196
$152
Significant flow
through upon
achieving scale
$72
Year 3
2021E
$49
Significant operating
leverage realized in
platform & processing
fees as business grows
| 20View entire presentation