J.P.Morgan 4Q23 Earnings Results
JPMORGAN CHASE & CO.
CREDIT-RELATED INFORMATION, CONTINUED
(in millions, except ratio data)
SUMMARY OF CHANGES IN THE ALLOWANCES
ALLOWANCE FOR LOAN LOSSES
Beginning balance
Net charge-offs:
Gross charge-offs
Gross recoveries collected
Net charge-offs
Provision for loan losses
Other
Ending balance
ALLOWANCE FOR LENDING-RELATED COMMITMENTS
Beginning balance
Provision for lending-related commitments
Other
Ending balance
ALLOWANCE FOR INVESTMENT SECURITIES
Total allowance for credit losses (a)
NET CHARGE-OFF/(RECOVERY) RATES
Consumer retained, excluding credit card loans
Credit card retained loans
Total consumer retained loans
Wholesale retained loans
Total retained loans
Memo: Average retained loans
Consumer retained, excluding credit card loans
Credit card retained loans
Total average retained consumer loans
Wholesale retained loans
Total average retained loans
$ 21,946
$
4Q23
$
2,557
(393)
2,164
2,625
13
22,420
$ 2,075
(100)
(1)
$ 1,974
128
$ 24,522
0.21%
2.79
1.08
0.31
0.68
$397,819
202,652
600,471
669,899
$1,270,370
3Q23
$ 21,980
1,869
$
(372)
1,497
1,479
(16)
$ 21,946
$ 2,186
(107)
(4)
$ 2,075
117
$ 24,138
0.17%
2.49
0.93
0.06
0.47
$ 396,788
195,232
592,020
667,825
$1,259,845
$ 20,053
$
$
$
2Q23
$
1,776
(365)
1,411
3,317
21
21,980
104
2,370
(188) (b)
4
2,186
$ 24,270
QUARTERLY TRENDS
0.14%
2.41
0.91
0.10
0.47
$ 359,543
187,027
546,570
647,474
$1,194,044
(b)
$
1Q23
$
19,139 (c) $
$
1,451
1,137
2,047
4
$ 20,053
(314)
$ 2,382
(13)
1
2,370
90
$ 22,513
0.18%
2.07
0.89
0.06
0.43
$ 300,585
180,451
481,036
601,401
$1,082,437
$
$
$
4Q22
18,185
1,210
(323)
887
2,426
2
19,726
2,551
(169)
2,382
96
$ 22,204
0.16%
1.62
0.70
0.03
0.33
$ 301,093
177,026
478,119
599,817
$1,077,936
4Q23 Change
3Q23
- %
37
(6)
45
77
NM
2
(5)
7
75
(5)
9
2
4
1
1
JPMORGAN CHASE & Co.
4Q22
21%
111
(22)
144
8
NM
14
(19)
41
NM
(17)
33
10
32
14
26
12
18
$ 19,139
$
2023
6,209
9,468
22
$ 22,420
$
$
7,653
(1,444)
2,382
(408) (b)
1,974
128
$ 24,522
0.17%
2.45
0.96
0.14
0.52
(b)
$364,061
191,412
555,473
646,875
$1,202,348
FULL YEAR
$
$
$
$
$
$
2022
16,386
4,326
(1,473)
2,853
6,189
4
19,726
2,261
120
1
2,382
96
22,204
0.09 %
1.47
0.58
0.03
0.27
$299,409
163,335
462,744
582,021
$1,044,765
2023 Change
2022
17%
77
2
118
53
450
14
5
NM
NM
(17)
33
10
22
17
20
11
15
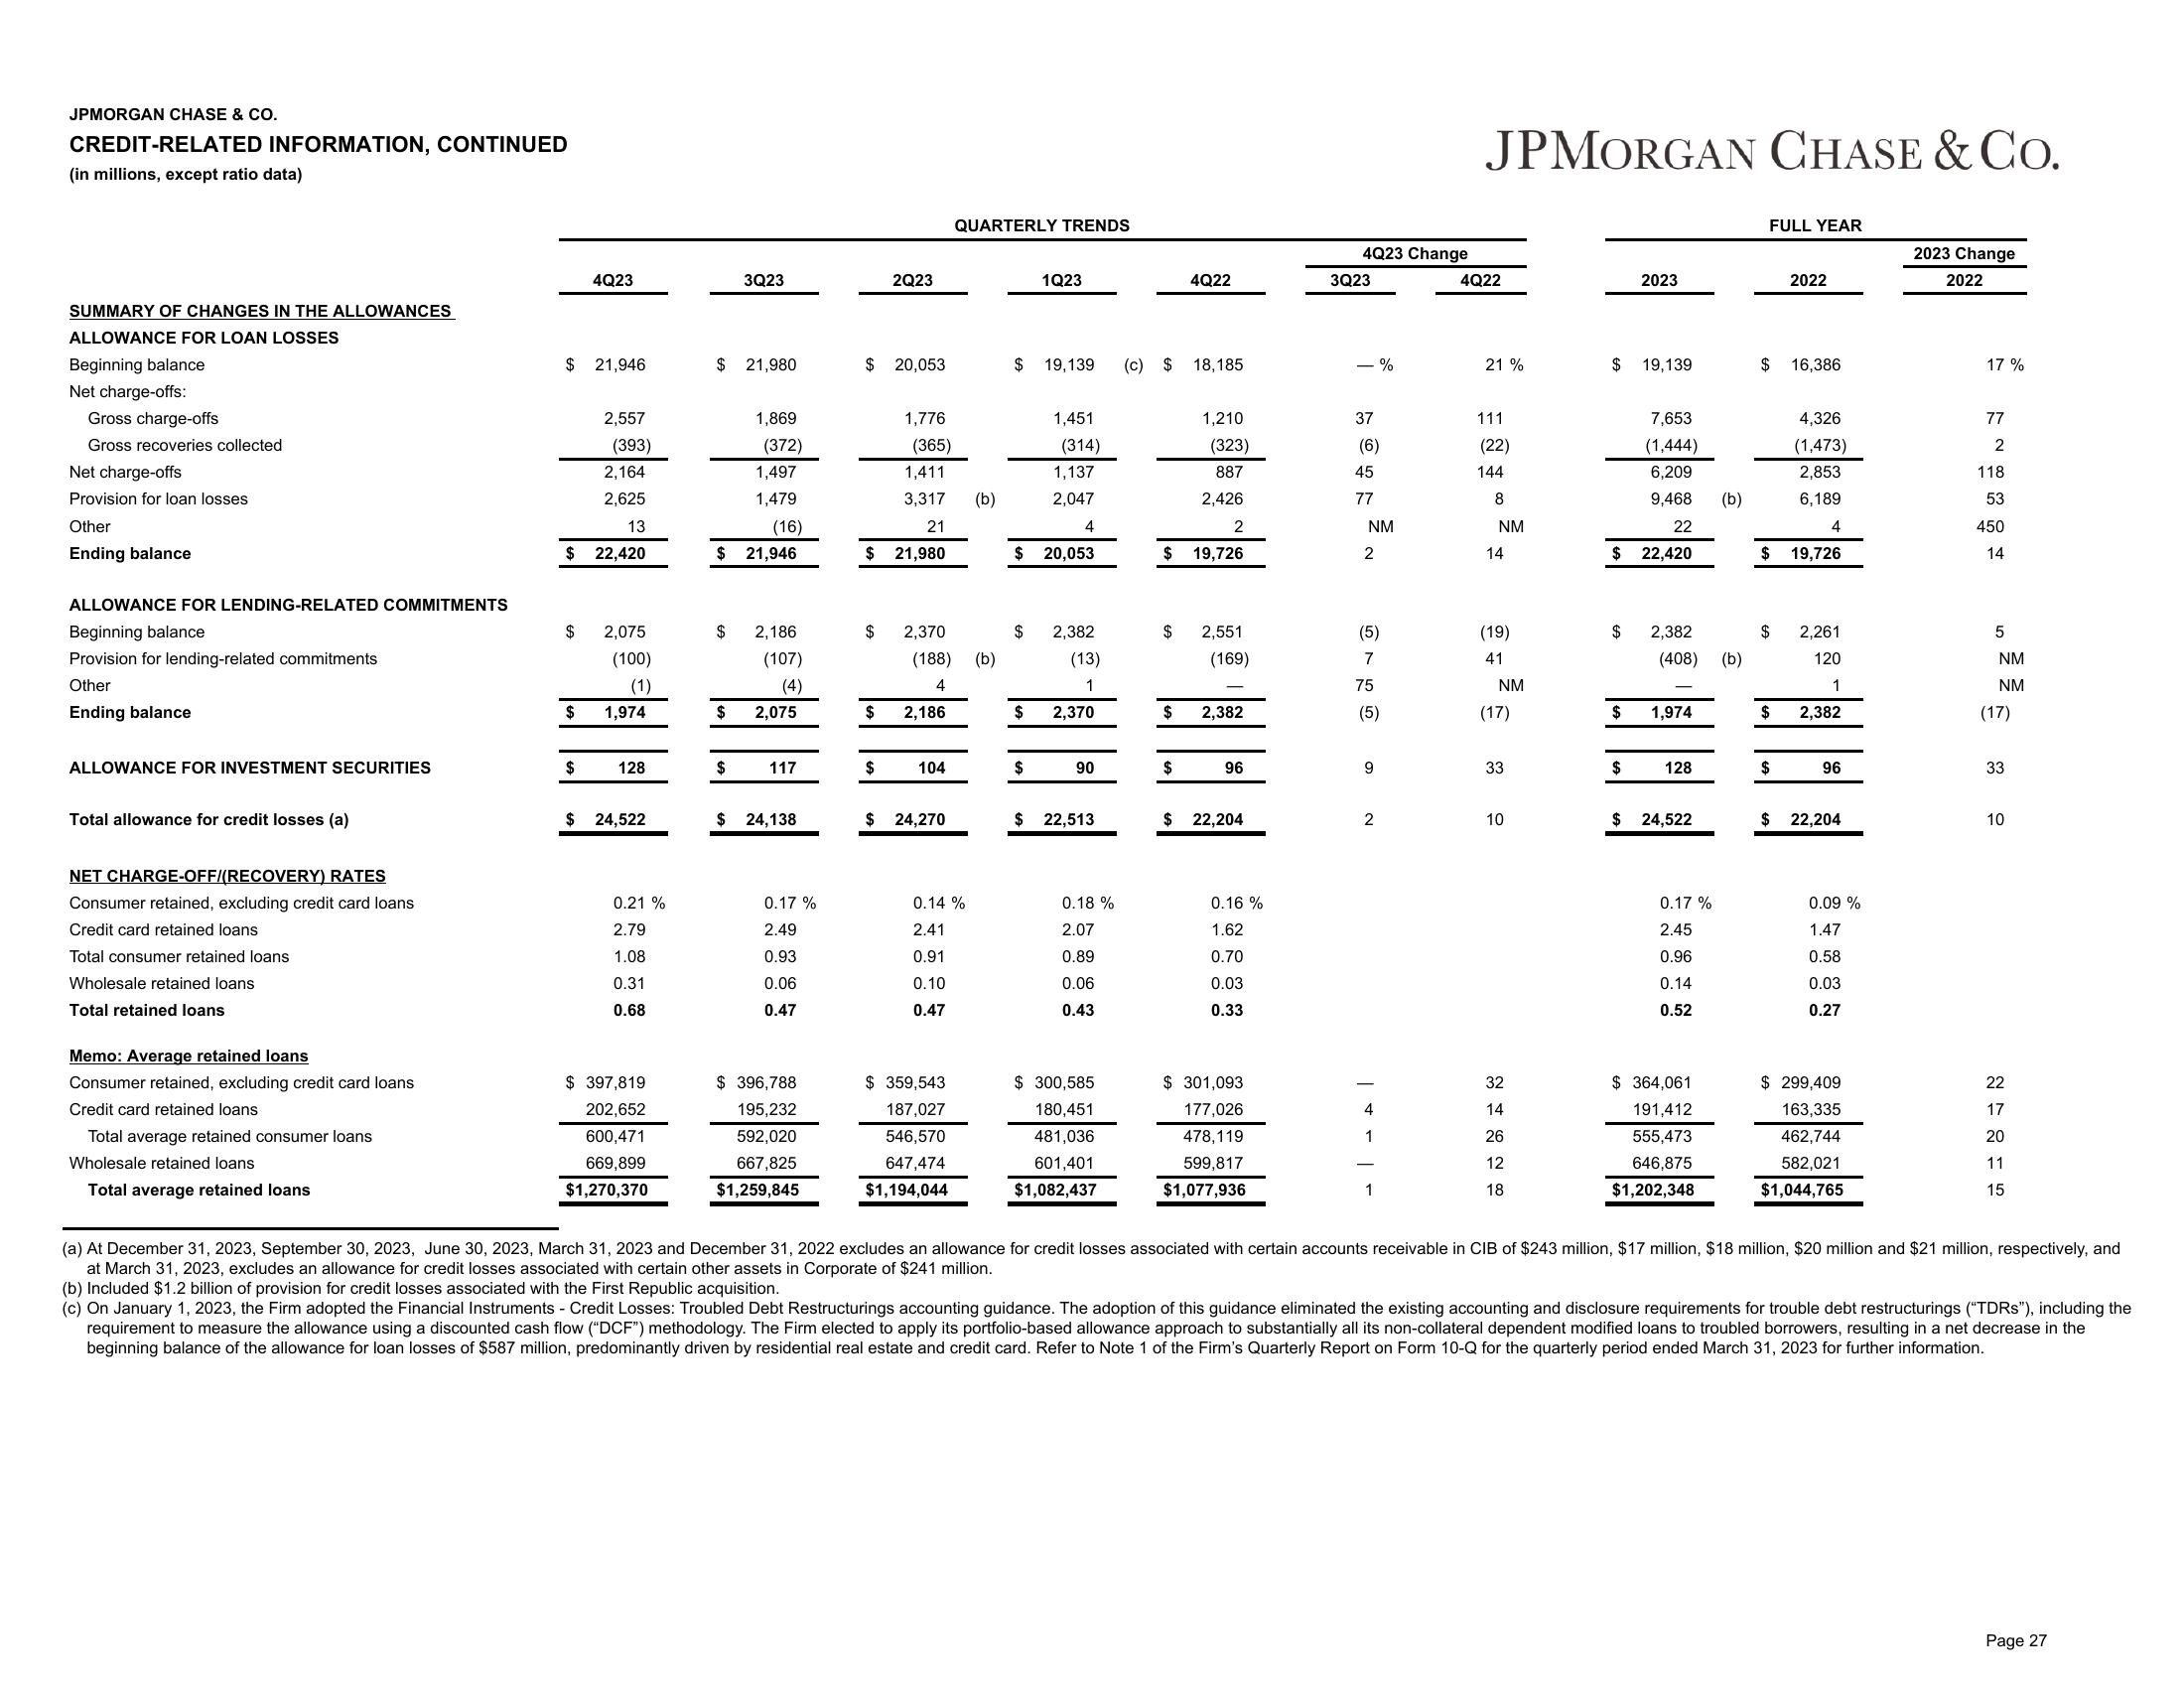
(a) At December 31, 2023, September 30, 2023, June 30, 2023, March 31, 2023 and December 31, 2022 excludes an allowance for credit losses associated with certain accounts receivable in CIB of $243 million, $17 million, $18 million, $20 million and $21 million, respectively, and
at March 31, 2023, excludes an allowance for credit losses associated with certain other assets in Corporate of $241 million.
(b) Included $1.2 billion of provision for credit losses associated with the First Republic acquisition.
(c) On January 1, 2023, the Firm adopted the Financial Instruments - Credit Losses: Troubled Debt Restructurings accounting guidance. The adoption of this guidance eliminated the existing accounting and disclosure requirements for trouble debt restructurings ("TDRs"), including the
requirement to measure the allowance using a discounted cash flow ("DCF") methodology. The Firm elected to apply its portfolio-based allowance approach to substantially all its non-collateral dependent modified loans to troubled borrowers, resulting in a net decrease in the
beginning balance of the allowance for loan losses of $587 million, predominantly driven by residential real estate and credit card. Refer to Note 1 of the Firm's Quarterly Report on Form 10-Q for the quarterly period ended March 31, 2023 for further information.
Page 27View entire presentation