Benson Hill SPAC Presentation Deck
BENSON HILL
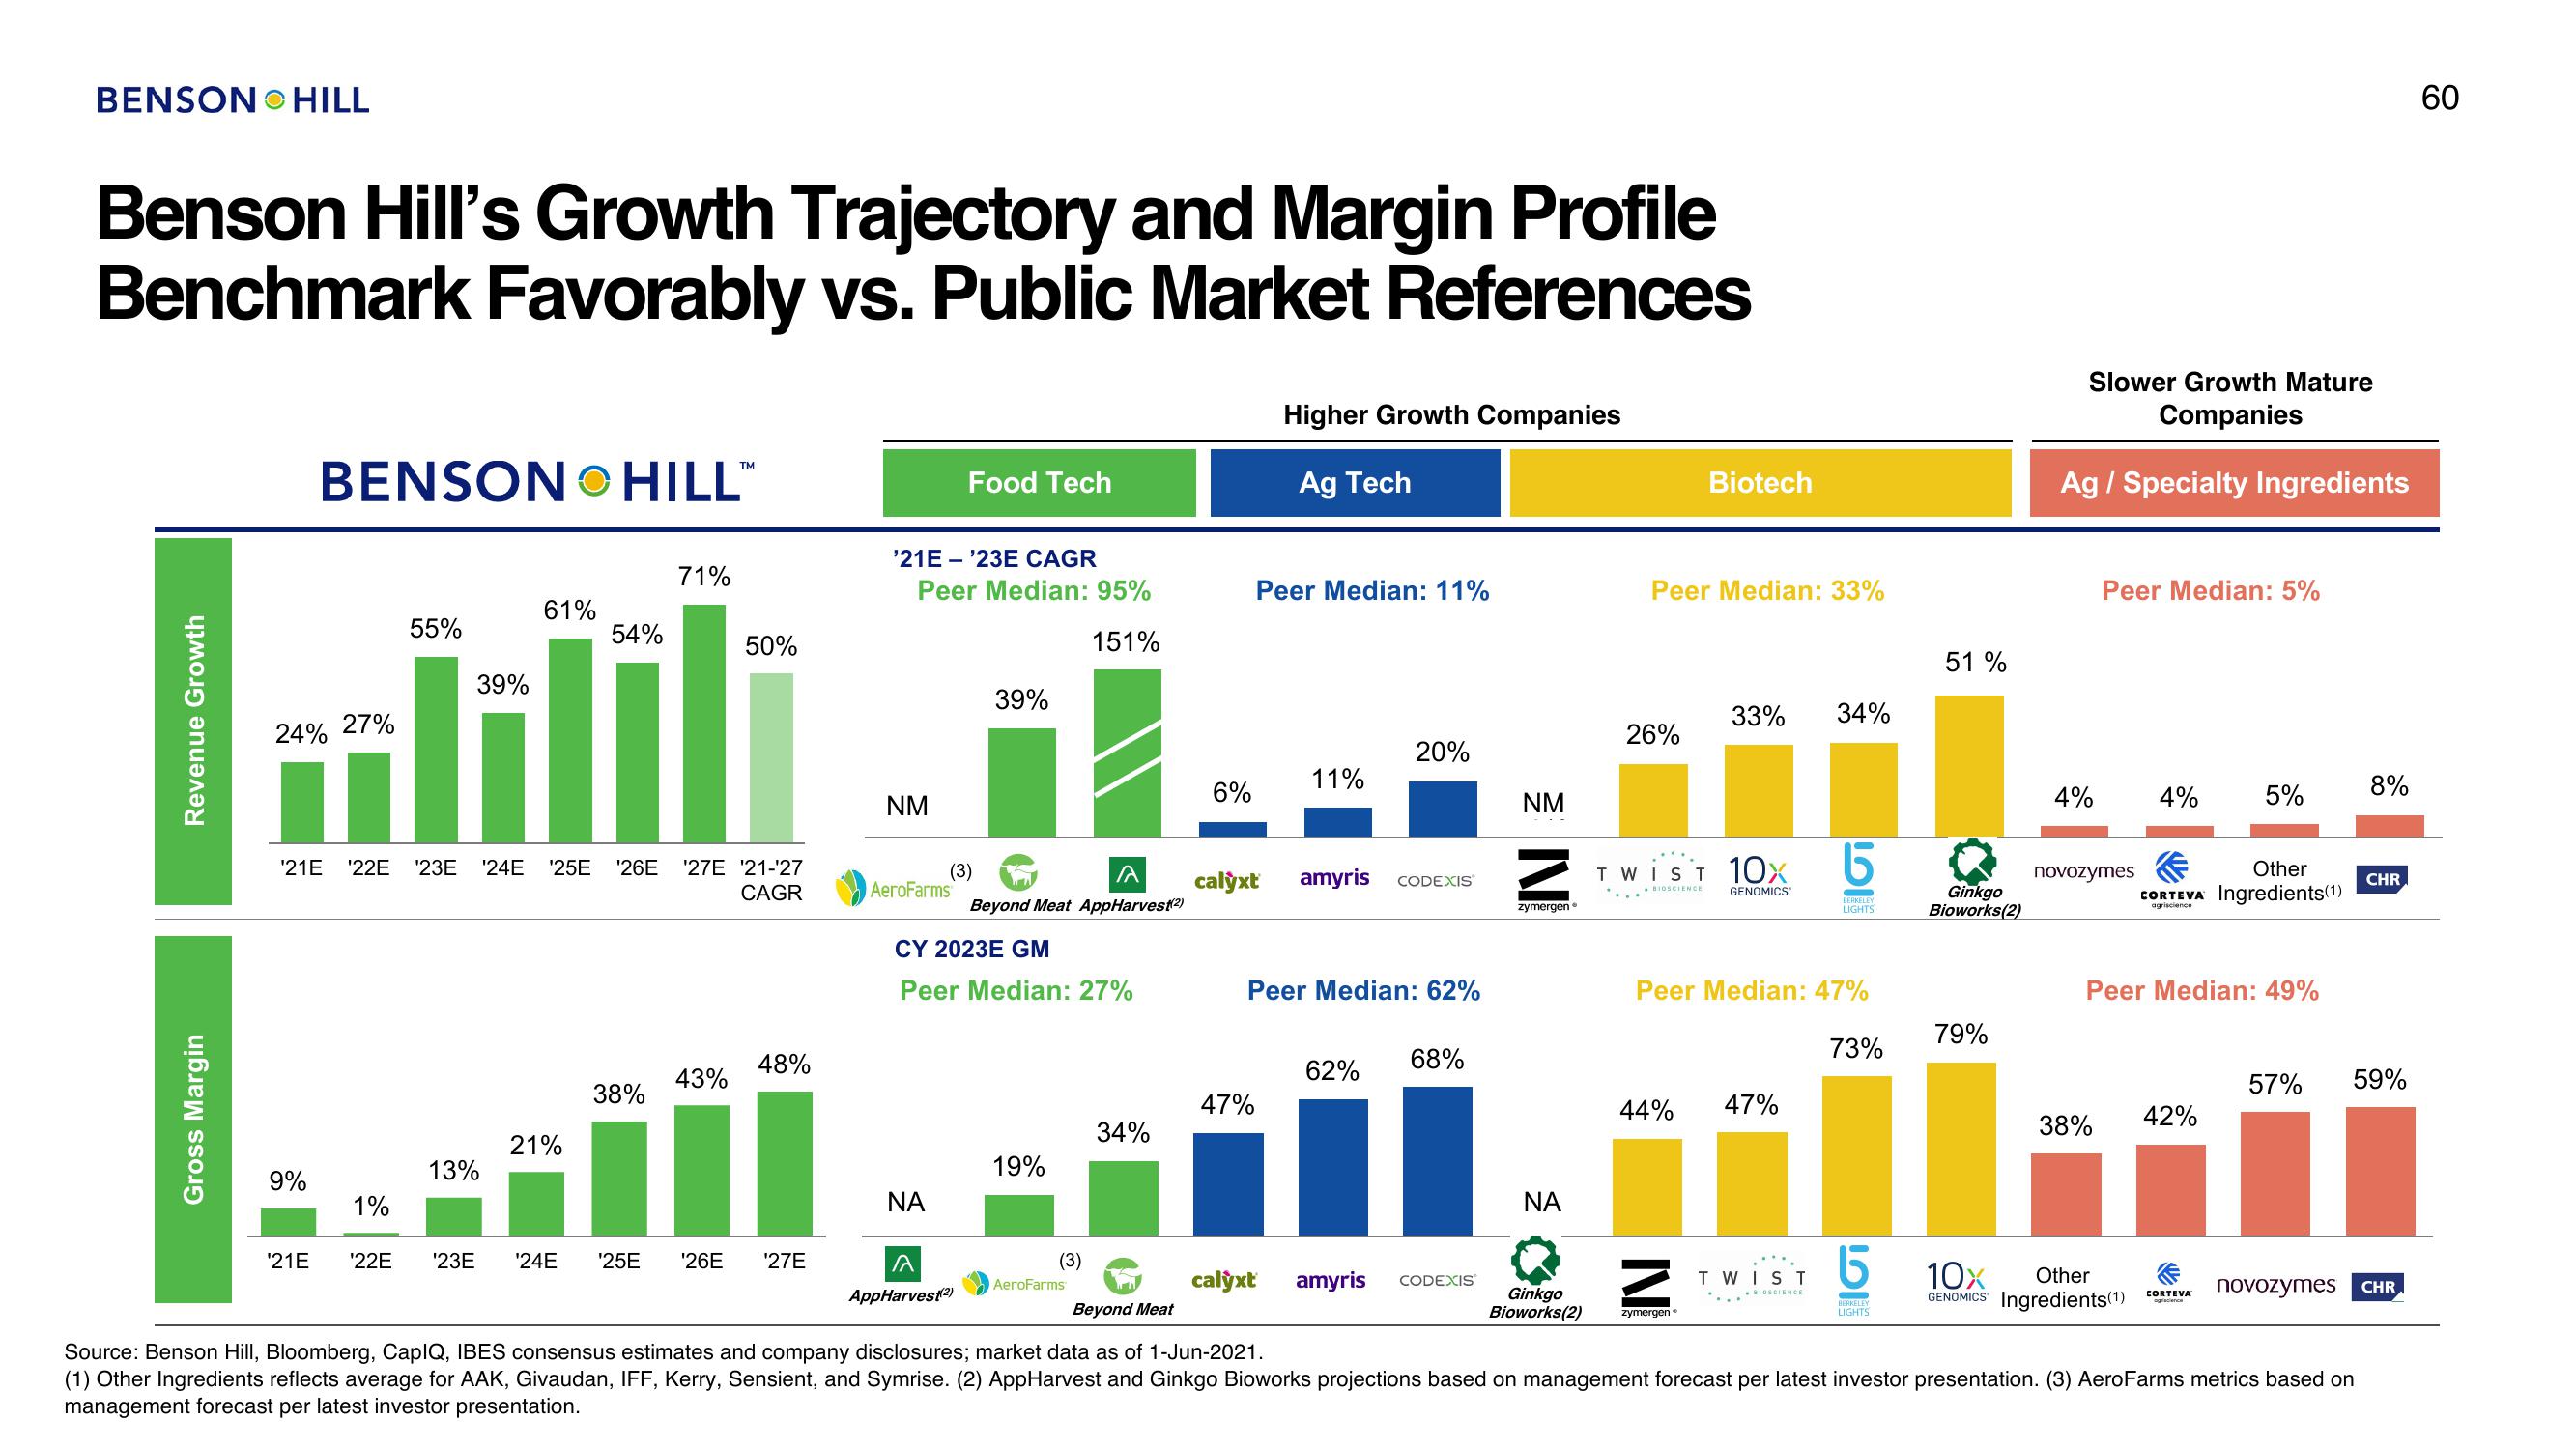
Benson Hill's Growth Trajectory and Margin Profile
Benchmark Favorably vs. Public Market References
Revenue Growth
Gross Margin
BENSON HILL
24% 27%
9%
1%
55%
'21E '22E
39%
¹21E ¹22E ¹23E '24E '25E ¹26E '27E '21-'27
CAGR
13%
'23E
61%
54%
21%
71%
38%
50%
43%
48%
'24E ¹25E '26E '27E
'21E-'23E CAGR
Peer Median: 95%
151%
NM
Food Tech
AeroFarms
(3)
ΝΑ
AppHarvest(2)
39%
CY 2023E GM
Peer Median: 27%
AA
Beyond Meat AppHarvest(2)
19%
(3)
AeroFarms
34%
6%
calyxt
Peer Median: 11%
47%
Higher Growth Companies
Ag Tech
calyxt
11%
amyris
Peer Median: 62%
20%
62%
CODEXIS
68%
amyris CODEXIS
NM
z
zymergen
ΝΑ
Peer Median: 33%
26%
Biotech
TWIST 10X
GENOMICS
44%
33% 34%
z
Ginkgo
Bioworks(2) zymergen
Peer Median: 47%
47%
TWIST
6
BERKELEY
LIGHTS
BIOSCIENCE
73%
6
BERKELEY
LIGHTS
51%
Ginkgo
Bioworks(2)
79%
Slower Growth Mature
Companies
Ag / Specialty Ingredients
4%
Peer Median: 5%
novozymes
4%
Other
10x
GENOMICS Ingredients(1)
Other
CORTEVA Ingredients(1)
agriscience
Peer Median: 49%
38% 42%
5%
CORTEVA
ogracience
8%
CHR
57% 59%
Beyond Meat
Source: Benson Hill, Bloomberg, CapIQ, IBES consensus estimates and company disclosures; market data as of 1-Jun-2021.
(1) Other Ingredients reflects average for AAK, Givaudan, IFF, Kerry, Sensient, and Symrise. (2) AppHarvest and Ginkgo Bioworks projections based on management forecast per latest investor presentation. (3) AeroFarms metrics based on
management forecast per latest investor presentation.
novozymes CHR
60View entire presentation