WeWork Investor Presentation Deck
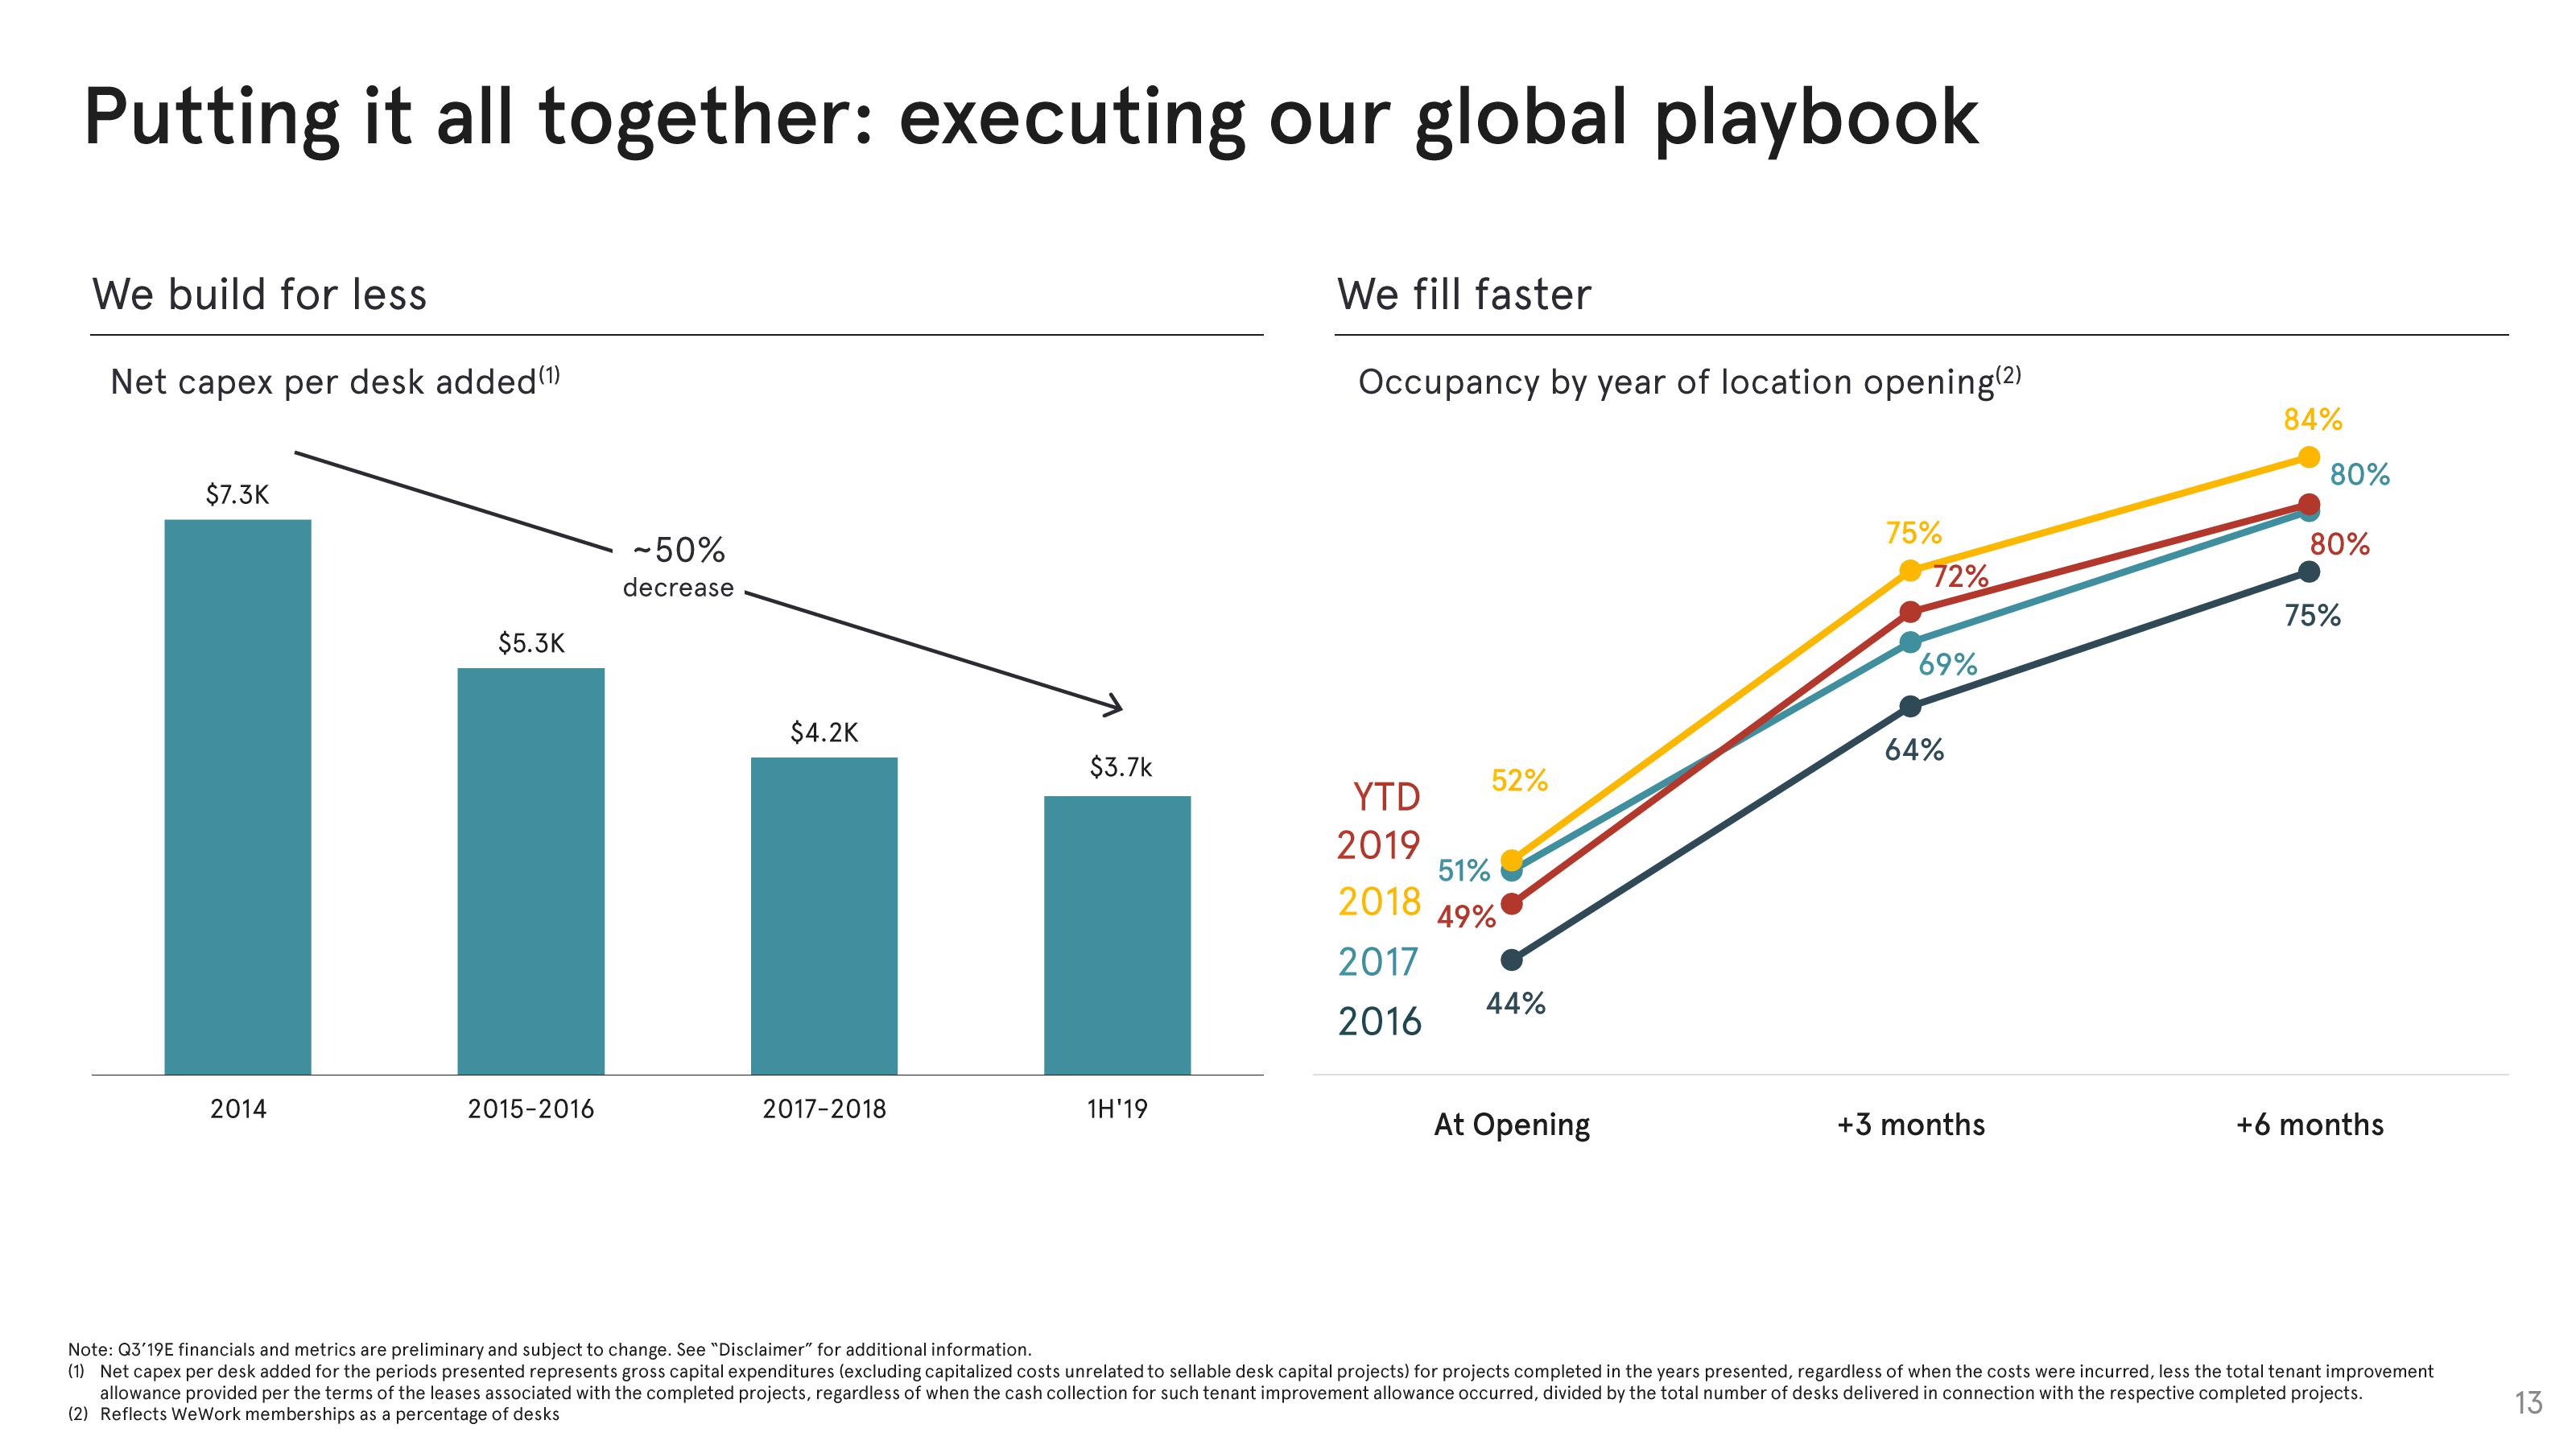
Putting it all together: executing our global playbook
We build for less
Net capex per desk added (1)
$7.3K
2014
$5.3K
2015-2016
-50%
decrease
$4.2K
2017-2018
$3.7k
1H'19
We fill faster
Occupancy by year of location opening(2)
YTD
2019
52%
51%
2018 49%
2017
2016
44%
At Opening
75%
72%
69%
64%
+3 months
84%
80%
80%
75%
+6 months
Note: Q3'19E financials and metrics are preliminary and subject to change. See "Disclaimer" for additional information.
(1) Net capex per desk added for the periods presented represents gross capital expenditures (excluding capitalized costs unrelated to sellable desk capital projects) for projects completed in the years presented, regardless of when the costs were incurred, less the total tenant improvement
allowance provided per the terms of the leases associated with the completed projects, regardless of when the cash collection for such tenant improvement allowance occurred, divided by the total number of desks delivered in connection with the respective completed projects.
(2) Reflects WeWork memberships as a percentage of desks
13View entire presentation